Hartford Financial Services logged a 2.1% change during today's afternoon session, and is now trading at a price of $134.96 per share.
Hartford Financial Services returned gains of 10.5% last year, with its stock price reaching a high of $135.27 and a low of $104.93. Over the same period, the stock underperformed the S&P 500 index by -1.2%. The company's 50-day average price was $129.57. The Hartford Insurance Group, Inc., together with its subsidiaries, provides insurance and financial services to individual and business customers in the United States, the United Kingdom, and internationally. Based in Hartford, CT, the Large-Cap Finance company has 19,100 full time employees. Hartford Financial Services has offered a 1.6% dividend yield over the last 12 months.
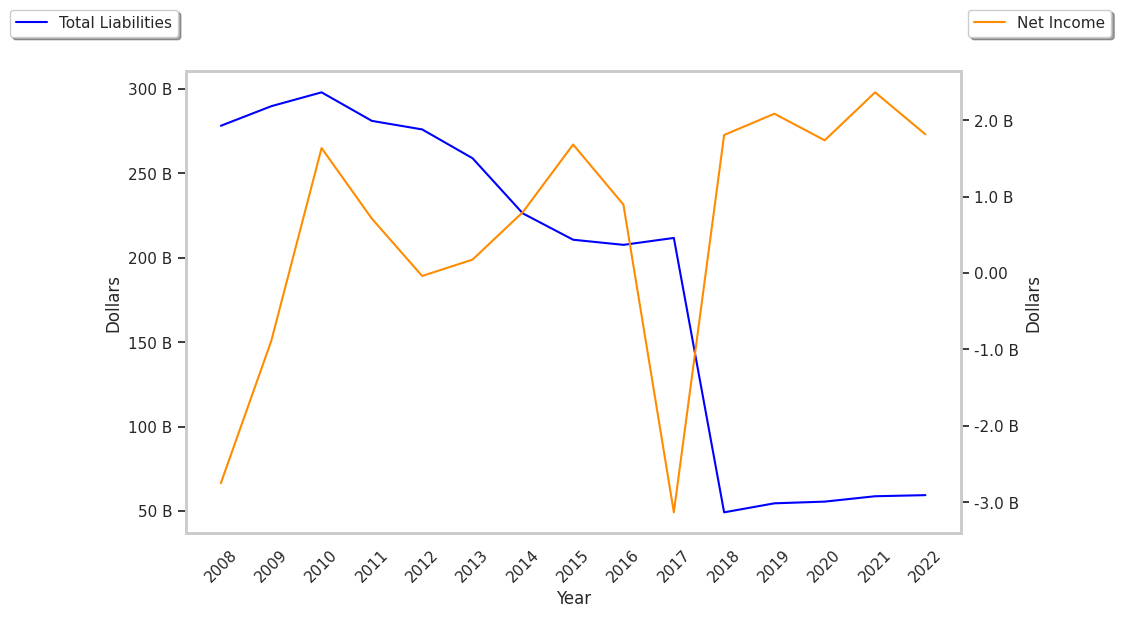
Growing Revenues and Good EPS Growth:
| 2019 | 2020 | 2021 | 2022 | 2023 | 2024 | |
|---|---|---|---|---|---|---|
| Revenue (M) | $20,740 | $20,523 | $22,390 | $22,362 | $24,527 | $26,535 |
| Interest Income (M) | $259 | $236 | $234 | $213 | $199 | $199 |
| Operating Margins | 12% | 10% | 13% | 10% | 13% | 15% |
| Net Margins | 10% | 8% | 11% | 8% | 10% | 12% |
| Net Income (M) | $2,085 | $1,737 | $2,371 | $1,819 | $2,504 | $3,111 |
| Depreciation & Amort. (M) | $451 | $562 | $680 | $625 | $510 | $177 |
| Diluted Shares (M) | 365 | 361 | 354 | 330 | 312 | 299 |
| Earnings Per Share | $5.66 | $4.76 | $6.64 | $5.46 | $7.97 | $10.35 |
| EPS Growth | n/a | -15.9% | 39.5% | -17.77% | 45.97% | 29.86% |
| Avg. Price | $49.68 | $40.16 | $61.33 | $68.13 | $80.38 | $134.21 |
| P/E Ratio | 8.69 | 8.38 | 9.11 | 12.3 | 9.94 | 12.77 |
| Free Cash Flow (M) | $3,384 | $3,757 | $3,960 | $3,833 | $4,005 | $5,764 |
| CAPEX (M) | $105 | $114 | $133 | $175 | $215 | $145 |
| EV / EBITDA | 7.48 | 6.93 | 7.44 | 9.26 | 8.17 | 10.94 |
| Total Debt (M) | $4,848 | $4,352 | $4,944 | $4,357 | $4,362 | $4,366 |
| Net Debt / EBITDA | 1.55 | 1.57 | 1.32 | 1.43 | 1.18 | 1.03 |
Hartford Financial Services has growing revenues and increasing reinvestment in the business and generally positive cash flows. Additionally, the company's financial statements display low leverage levels and a strong EPS growth trend. Furthermore, Hartford Financial Services has weak operating margins with a positive growth rate.
a Very Low P/E Ratio but Its Shares Are Expensive:
Hartford Financial Services has a trailing twelve month P/E ratio of 10.6, compared to an average of 15.92 for the Finance sector. Based on its EPS guidance of $11.61, the company has a forward P/E ratio of 11.2. The 10.8% compound average growth rate of Hartford Financial Services's historical and projected earnings per share yields a PEG ratio of 0.98. This suggests that its shares are undervalued. In contrast, Hartford Financial Services is likely overvalued compared to the book value of its equity, since its P/B ratio of 2.08 is higher than the sector average of 1.78. The company's shares are currently trading 19.2% below their Graham number.
Hartford Financial Services Has an Average Rating of Buy:
The 18 analysts following Hartford Financial Services have set target prices ranging from $120.0 to $163.0 per share, for an average of $142.06 with a buy rating. The company is trading -5.0% away from its average target price, indicating that there is an analyst consensus of some upside potential.
Hartford Financial Services has an average amount of shares sold short because 2.1% of the company's shares are sold short. Institutions own 94.6% of the company's shares, and the insider ownership rate stands at 0.33%, suggesting a small amount of insider investors. The largest shareholder is Vanguard Group Inc, whose 13% stake in the company is worth $4,973,937,956.