Phillips 66 logged a 0.9% change during today's morning session, and is now trading at a price of $135.7 per share.
Over the last year, Phillips 66 logged a 2.3% change, with its stock price reaching a high of $143.25 and a low of $91.01. Over the same period, the stock underperformed the S&P 500 index by -9.3%. AThe company's 50-day average price was $134.26. Phillips 66 operates as an energy manufacturing and logistics company in the United States, the United Kingdom, Germany, and internationally. Based in Houston, TX, the Large-Cap Energy company has 13,200 full time employees. Phillips 66 has offered a 3.5% dividend yield over the last 12 months.
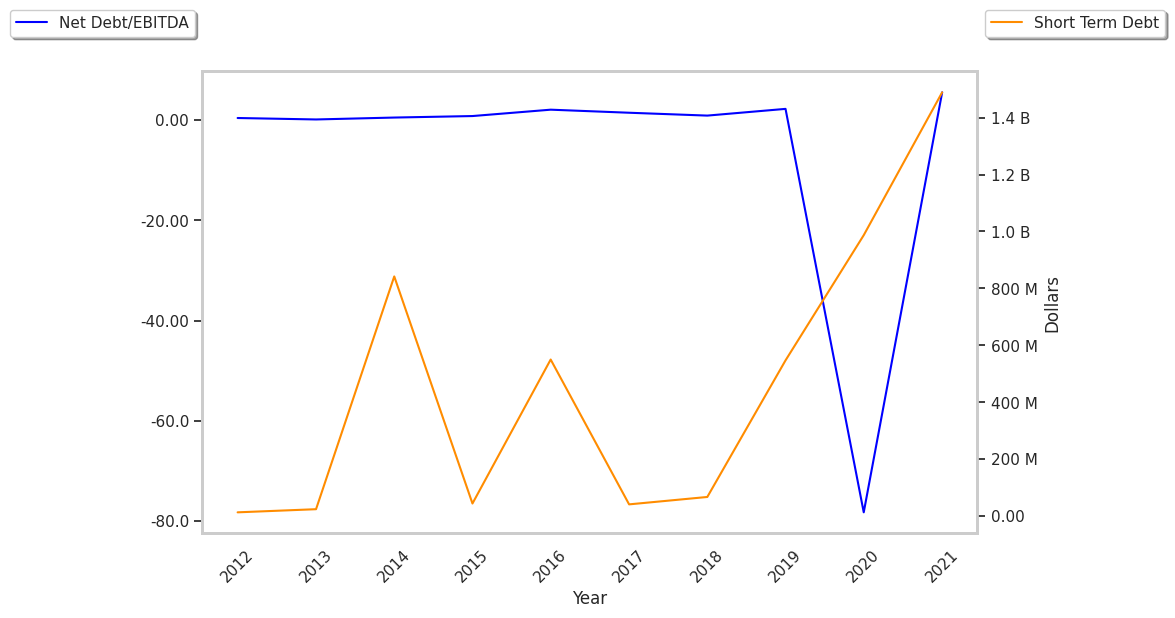
The Company Has a Highly Leveraged Balance Sheet and a Declining EPS Growth Trend:
| 2019 | 2020 | 2021 | 2022 | 2023 | 2024 | |
|---|---|---|---|---|---|---|
| Revenue (M) | $107,293 | $64,129 | $111,476 | $169,990 | $147,399 | $143,153 |
| Operating Margins | 4% | -8% | 1% | 6% | 5% | 1% |
| Net Margins | 3% | -6% | 1% | 6% | 5% | 1% |
| Net Income (M) | $3,076 | -$3,975 | $1,317 | $11,024 | $7,015 | $2,117 |
| Net Interest Expense (M) | $458 | $499 | $581 | $619 | $897 | $919 |
| Depreciation & Amort. (M) | $1,341 | $1,395 | $1,605 | $1,629 | $1,977 | $2,363 |
| Diluted Shares (M) | 454 | 440 | 440 | 474 | 453 | 422 |
| Earnings Per Share | $6.77 | -$9.06 | $2.97 | $23.27 | $15.48 | $4.99 |
| EPS Growth | n/a | -233.83% | 132.78% | 683.5% | -33.48% | -67.76% |
| Avg. Price | $83.37 | $59.15 | $71.26 | $83.67 | $133.14 | $134.49 |
| P/E Ratio | 12.26 | -6.53 | 23.99 | 3.58 | 8.56 | 26.84 |
| Free Cash Flow (M) | $935 | -$809 | $4,157 | $8,619 | $4,611 | $2,332 |
| CAPEX (M) | $3,873 | $2,920 | $1,860 | $2,194 | $2,418 | $1,859 |
| EV / EBITDA | 8.71 | -11.03 | 14.52 | 3.77 | 8.65 | 16.93 |
| Total Debt (M) | $11,763 | $15,893 | $14,448 | $17,190 | $19,359 | $20,062 |
| Net Debt / EBITDA | 1.84 | -3.75 | 3.87 | 0.87 | 1.78 | 4.09 |
| Current Ratio | 1.24 | 1.39 | 1.15 | 1.38 | 1.26 | 1.19 |
Phillips 66 has weak operating margins with a negative growth trend, declining EPS growth, and a highly leveraged balance sheet. On the other hand, the company has generally positive cash flows working in its favor. Furthermore, Phillips 66 has growing revenues and decreasing reinvestment in the business and just enough current assets to cover current liabilities, as shown by its current ratio of 1.19.
Phillips 66's Valuation Is in Line With Its Sector Averages:
Phillips 66 has a trailing twelve month P/E ratio of 36.2, compared to an average of 18.35 for the Energy sector. Based on its EPS guidance of $9.49, the company has a forward P/E ratio of 14.1. The 4.9% compound average growth rate of Phillips 66's historical and projected earnings per share yields a PEG ratio of 7.32. This suggests that these shares are overvalued. Furthermore, Phillips 66 is likely overvalued compared to the book value of its equity, since its P/B ratio of 2.03 is higher than the sector average of 1.6. The company's shares are currently trading 58.9% below their Graham number.
Phillips 66 Has an Average Rating of Buy:
The 20 analysts following Phillips 66 have set target prices ranging from $129.0 to $170.0 per share, for an average of $147.65 with a buy rating. The company is trading -8.1% away from its average target price, indicating that there is an analyst consensus of some upside potential.
Phillips 66 has a very low short interest because 1.8% of the company's shares are sold short. Institutions own 78.0% of the company's shares, and the insider ownership rate stands at 0.26%, suggesting a small amount of insider investors. The largest shareholder is Vanguard Group Inc, whose 13% stake in the company is worth $7,019,022,362.