Comfort Systems U logged a -1.3% change during today's morning session, and is now trading at a price of $933.12 per share.
Comfort Systems U returned gains of 87.5% last year, with its stock price reaching a high of $1020.26 and a low of $276.44. Over the same period, the stock outperformed the S&P 500 index by 76.1%. More recently, the company's 50-day average price was $875.25. Comfort Systems USA, Inc., together with its subsidiaries, provides mechanical and electrical installation, renovation, maintenance, repair, and replacement services for the mechanical and electrical services industry in the United States. Based in Houston, TX, the Large-Cap Industrials company has 18,300 full time employees. Comfort Systems U has offered a 0.2% dividend yield over the last 12 months.
Strong Revenue Growth but Slimmer Gross Margins than the Industry Average of 27.71%:
| 2019 | 2020 | 2021 | 2022 | 2023 | 2024 | |
|---|---|---|---|---|---|---|
| Revenue (M) | $2,615 | $2,857 | $3,074 | $4,140 | $5,207 | $7,027 |
| Gross Margins | 19% | 19% | 18% | 18% | 19% | 21% |
| Net Margins | 4% | 5% | 5% | 6% | 6% | 7% |
| Net Income (M) | $114 | $150 | $143 | $246 | $323 | $522 |
| Net Interest Expense (M) | $9 | $8 | $6 | $13 | $10 | $7 |
| Depreciation & Amort. (M) | $24 | $28 | $28 | $34 | $38 | $48 |
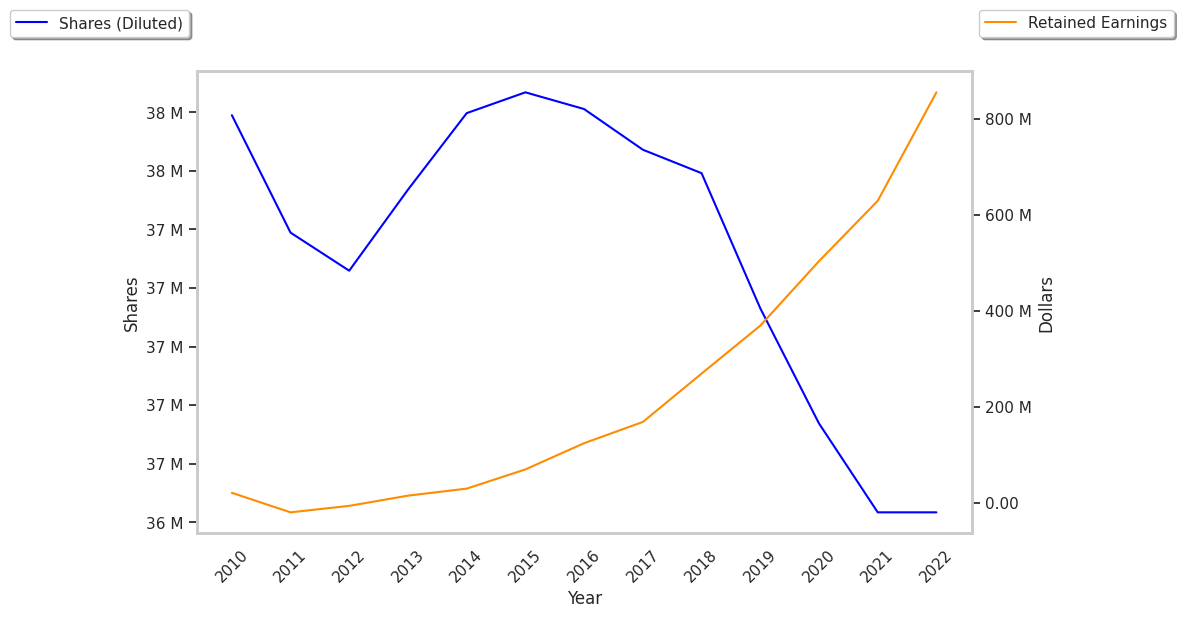
| Diluted Shares (M) | 37 | 37 | 36 | 36 | 36 | 36 |
| Earnings Per Share | $3.08 | $4.09 | $3.93 | $6.82 | $9.01 | $14.6 |
| EPS Growth | n/a | 32.79% | -3.91% | 73.54% | 32.11% | 62.04% |
| Avg. Price | $47.0 | $44.27 | $77.39 | $87.2 | $205.67 | $945.07 |
| P/E Ratio | 15.16 | 10.77 | 19.59 | 12.75 | 22.78 | 64.55 |
| Free Cash Flow (M) | $110 | $262 | $158 | $253 | $545 | $738 |
| CAPEX (M) | $32 | $24 | $22 | $48 | $95 | $111 |
| EV / EBITDA | 10.25 | 8.24 | 14.44 | 12.15 | 15.76 | 41.69 |
| Total Debt (M) | $247 | $236 | $391 | $415 | $49 | $74 |
| Net Debt / EBITDA | 1.04 | 0.83 | 1.53 | 1.24 | -0.34 | -0.6 |
| Current Ratio | 1.3 | 1.17 | 1.23 | 1.12 | 1.11 | 1.08 |
Comfort Systems U has rapidly growing revenues and increasing reinvestment in the business and exceptional EPS growth. Additionally, the company's financial statements display generally positive cash flows and healthy leverage levels. However, the firm has slimmer gross margins than its peers. Finally, we note that Comfort Systems U has just enough current assets to cover current liabilities, as shown by its current ratio of 1.08.
The Market May Be Overvaluing Comfort Systems U's Earnings and Assets:
Comfort Systems U has a trailing twelve month P/E ratio of 37.0, compared to an average of 24.03 for the Industrials sector. Based on its EPS guidance of $16.99, the company has a forward P/E ratio of 51.5. According to the 27.6% compound average growth rate of Comfort Systems U's historical and projected earnings per share, the company's PEG ratio is 1.34. Taking the weighted average of the company's EPS CAGR and the broader market's 5-year projected EPS growth rate, we obtain a normalized growth rate of 16.1%. On this basis, the company's PEG ratio is 2.3. This suggests that these shares are overvalued. Furthermore, Comfort Systems U is likely overvalued compared to the book value of its equity, since its P/B ratio of 14.7 is higher than the sector average of 2.89. The company's shares are currently trading 645.8% below their Graham number. Overall, Comfort Systems U's lofty valuation in terms of earnings and assets is to some extent attenuated by its strong cash flow trend and reasonable levels of debt.
Comfort Systems U Has an Analyst Consensus of Some Upside Potential:
Comfort Systems U has an average amount of shares sold short because 2.1% of the company's shares are sold short. Institutions own 98.2% of the company's shares, and the insider ownership rate stands at 1.37%, suggesting a large amount of insider shareholders. The largest shareholder is Blackrock Inc., whose 11% stake in the company is worth $3,711,546,987.