Illinois Tool Works may be undervalued with mixed growth prospects, but the 16 analysts following the company give it an rating of hold. Their target prices range from $215.0 to $298.0 per share, for an average of $260.72. At today's price of $245.51, Illinois Tool Works is trading -5.83% away from its average target price, suggesting there is an analyst consensus of some upside potential for the stock.
Illinois Tool Works Inc. provides industrial products and equipment in North America, Europe, the Middle East, Africa, the Asia Pacific, and South America. Based in Glenview, IL, the Large-Cap Industrials company has 44,000 full time employees. Illinois Tool Works has provided a 2.5% dividend yield over the last 12 months.
Illinois Tool Works has a trailing twelve month P/E ratio of 23.8, compared to an average of 24.03 for the Industrials sector. Considering its EPS guidance of $10.7, the company has a forward P/E ratio of 22.9.
Illinois Tool Works is also overpriced compared to its book value, since its P/B ratio of 22.2 is higher than the sector average of 2.89.
| 2019 | 2020 | 2021 | 2022 | 2023 | 2024 | |
|---|---|---|---|---|---|---|
| Revenue (M) | $14,109 | $12,574 | $14,455 | $15,932 | $16,107 | $15,898 |
| Operating Margins | 24% | 23% | 24% | 24% | 25% | 27% |
| Net Margins | 18% | 17% | 19% | 19% | 18% | 22% |
| Net Income (M) | $2,521 | $2,109 | $2,694 | $3,034 | $2,957 | $3,488 |
| Net Interest Expense (M) | $221 | $206 | $202 | $203 | $266 | $248 |
| Depreciation & Amort. (M) | $267 | $273 | $277 | $276 | $282 | $301 |
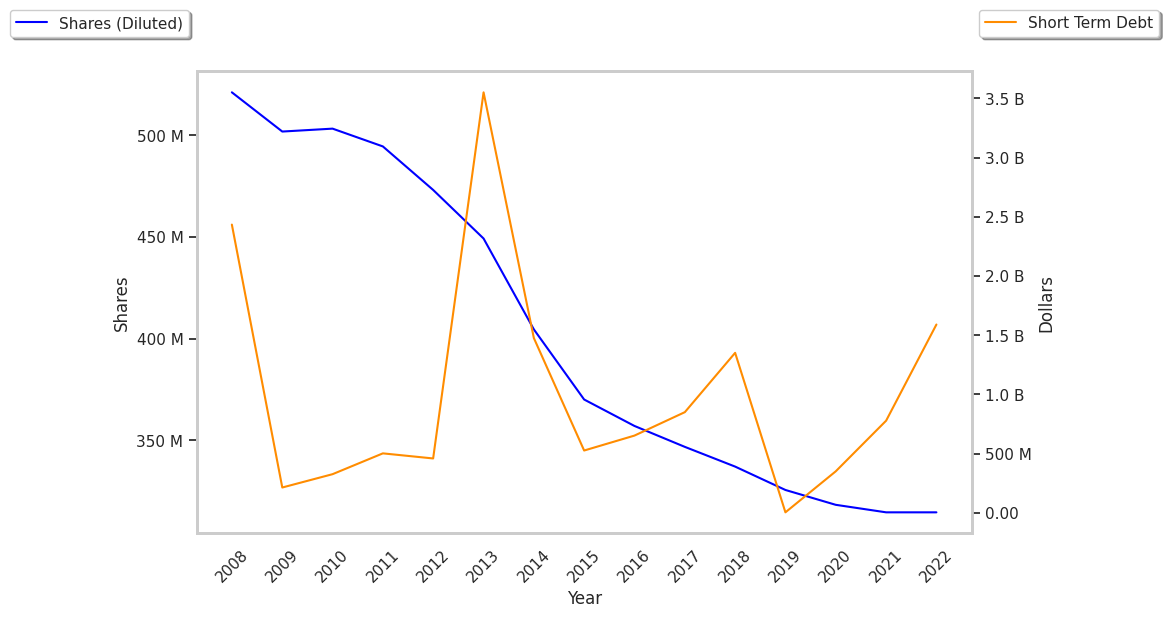
| Diluted Shares (M) | 326 | 318 | 316 | 311 | 304 | 298 |
| Earnings Per Share | $7.74 | $6.63 | $8.51 | $9.77 | $9.74 | $11.71 |
| EPS Growth | n/a | -14.34% | 28.36% | 14.81% | -0.31% | 20.23% |
| Avg. Price | $138.64 | $169.57 | $213.16 | $204.05 | $261.94 | $242.53 |
| P/E Ratio | 17.82 | 25.46 | 24.93 | 20.82 | 26.81 | 20.64 |
| Free Cash Flow (M) | $2,669 | $2,571 | $2,261 | $1,936 | $3,084 | $2,844 |
| CAPEX (M) | $326 | $236 | $296 | $412 | $455 | $437 |
| EV / EBITDA | 13.97 | 19.01 | 19.77 | 17.57 | 20.45 | 17.56 |
| Total Debt (M) | $7,762 | $8,472 | $8,255 | $8,298 | $9,525 | $8,640 |
| Net Debt / EBITDA | 1.58 | 1.87 | 1.79 | 1.87 | 1.96 | 1.68 |
| Current Ratio | 2.9 | 2.52 | 1.84 | 1.41 | 1.33 | 1.36 |