Now trading at a price of $229.35, Salesforce has moved -2.0% so far today.
Salesforce returned losses of -29.1% last year, with its stock price reaching a high of $369.0 and a low of $221.96. Over the same period, the stock underperformed the S&P 500 index by -41.8%. AThe company's 50-day average price was $244.41. Salesforce, Inc. provides customer relationship management (CRM) technology that connects companies and customers together worldwide. Based in San Francisco, CA, the Large-Cap Technology company has 76,453 full time employees. Salesforce has offered a 0.7% dividend yield over the last 12 months.
Wider Gross Margins Than the Industry Average of 63.49%:
| 2019 | 2020 | 2021 | 2022 | 2023 | 2024 | |
|---|---|---|---|---|---|---|
| Revenue (M) | $17,098 | $21,252 | $26,492 | $31,352 | $34,857 | $37,895 |
| Gross Margins | 75% | 74% | 73% | 73% | 75% | 77% |
| Net Margins | 1% | 19% | 5% | 1% | 12% | 16% |
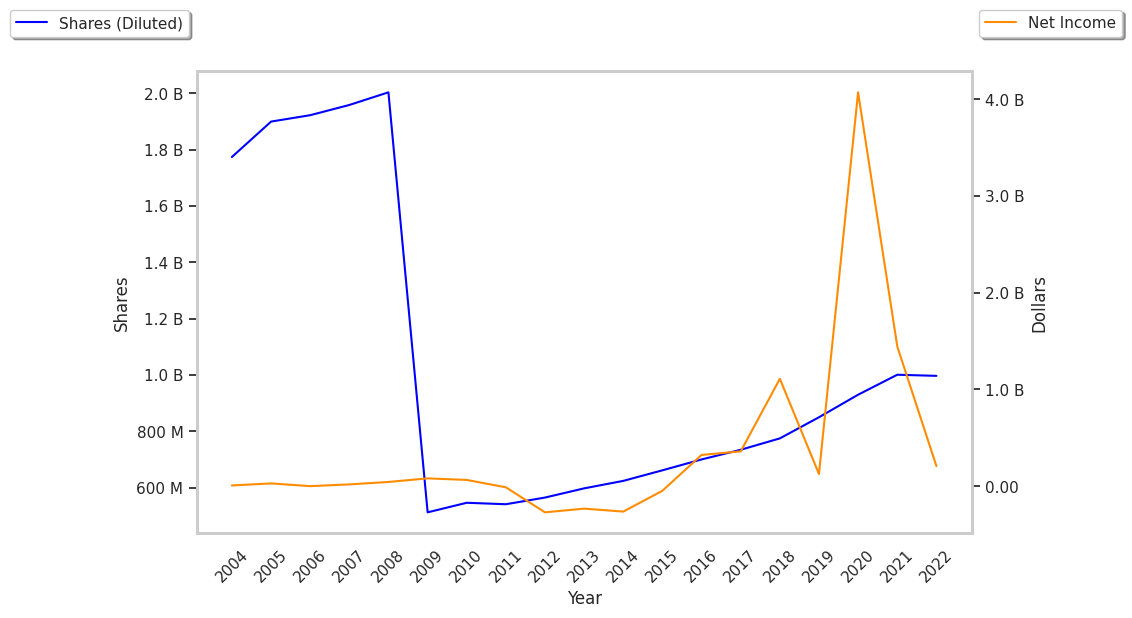
| Net Income (M) | $126 | $4,072 | $1,444 | $208 | $4,136 | $6,197 |
| Net Interest Expense (M) | $20 | $15 | $5 | $10 | $29 | $203 |
| Depreciation & Amort. (M) | $2,135 | $2,846 | $3,298 | $3,786 | $3,959 | $3,477 |
| Diluted Shares (M) | 939 | 1,001 | 1,000 | 981 | 965 | 970 |
| Earnings Per Share | $0.13 | $4.07 | $1.44 | $0.21 | $4.29 | $6.39 |
| EPS Growth | n/a | 3030.77% | -64.62% | -85.42% | 1942.86% | 48.95% |
| Avg. Price | $155.1 | $200.87 | $247.37 | $195.07 | $263.14 | $234.12 |
| P/E Ratio | 1107.86 | 45.45 | 169.43 | 928.9 | 61.77 | 36.3 |
| Free Cash Flow (M) | $3,688 | $4,091 | $5,283 | $6,313 | $9,498 | $12,434 |
| CAPEX (M) | $643 | $710 | $717 | $798 | $736 | $658 |
| EV / EBITDA | 57.75 | 58.63 | 67.61 | 43.08 | 29.44 | 21.62 |
| Total Debt (M) | $5,364 | $13,284 | $21,192 | $18,844 | $16,859 | $16,868 |
| Net Debt / EBITDA | 0.67 | 2.58 | 3.93 | 2.57 | 0.99 | 0.56 |
| Current Ratio | 1.22 | 1.06 | 1.05 | 1.04 | 1.11 | 1.07 |
Salesforce benefits from rapidly growing revenues and a flat capital expenditure trend, exceptional EPS growth, and generally positive cash flows. The company's financial statements show wider gross margins than its peer group and healthy leverage levels. Furthermore, Salesforce has just enough current assets to cover current liabilities, as shown by its current ratio of 1.07.
Forward Earnings Show Improvement but Priced at a Premium:
Salesforce has a trailing twelve month P/E ratio of 35.5, compared to an average of 30.44 for the Technology sector. Based on its EPS guidance of $11.13, the company has a forward P/E ratio of 22.0. According to the 88.8% compound average growth rate of Salesforce's historical and projected earnings per share, the company's PEG ratio is 0.4. Taking the weighted average of the company's EPS CAGR and the broader market's 5-year projected EPS growth rate, we obtain a normalized growth rate of 27.5%. On this basis, the company's PEG ratio is 1.29. This implies that the shares are fairly valued. Additionally, the market is possibly undervaluing Salesforce in terms of its equity because its P/B ratio is 3.57 whereas the sector average is 4.19. The company's shares are currently trading 141.9% below their Graham number.
Salesforce Has an Analyst Consensus of Strong Upside Potential:
The 50 analysts following Salesforce have set target prices ranging from $221.0 to $430.0 per share, for an average of $328.83 with a buy rating. The company is trading -30.3% away from its average target price, indicating that there is an analyst consensus of strong upside potential.
Salesforce has a very low short interest because 1.9% of the company's shares are sold short. Institutions own 83.2% of the company's shares, and the insider ownership rate stands at 2.59%, suggesting a large amount of insider shareholders. The largest shareholder is Vanguard Group Inc, whose 9% stake in the company is worth $20,543,396,772.