A strong performer from today's morning trading session is Intel, whose shares rose 2.7% to $36.81 per share. For those of you thinking about investing in the stock, here is a brief value analysis of the stock using the company's basic fundamental ratios.
Intel's Valuation Is in Line With Its Sector Averages:
Intel Corporation designs, develops, manufactures, markets, and sells computing and related products and services worldwide. The company belongs to the Technology sector, which has an average price to earnings (P/E) ratio of 30.44 and an average price to book (P/B) ratio of 4.19. In contrast, Intel has a trailing 12 month P/E ratio of 613.5 and a P/B ratio of 1.65.
Intel has moved 53.1% over the last year compared to 12.9% for the S&P 500 — a difference of 40.1%. Intel has a 52 week high of $42.48 and a 52 week low of $17.67.
Healthy Debt Levels but a Declining EPS Growth Trend:
| 2019 | 2020 | 2021 | 2022 | 2023 | 2024 | |
|---|---|---|---|---|---|---|
| Revenue (M) | $71,965 | $77,867 | $79,024 | $63,054 | $54,228 | $53,101 |
| Gross Margins | 59.0% | 56.0% | 55.0% | n/a | 40.0% | 33.0% |
| Net Margins | 28% | 27% | 25% | 13% | 3% | -35% |
| Net Income (M) | $21,048 | $20,899 | $19,868 | $8,017 | $1,689 | -$18,756 |
| Net Interest Expense (M) | $484 | -$504 | -$482 | n/a | $629 | $987 |
| Depreciation & Amort. (M) | $9,204 | $10,482 | $9,953 | $11,128 | $7,847 | $9,951 |
| Diluted Shares (M) | 4,473 | 4,232 | 4,090 | 4,123 | 4,212 | 4,280 |
| Earnings Per Share | $4.71 | $4.94 | $4.86 | $1.94 | $0.4 | -$4.38 |
| EPS Growth | n/a | 4.88% | -1.62% | -60.08% | -79.38% | -1195.0% |
| Avg. Price | $45.74 | $49.98 | $52.18 | $43.95 | $50.25 | $36.81 |
| P/E Ratio | 9.59 | 10.04 | 10.67 | 22.65 | 125.62 | -8.4 |
| Free Cash Flow (M) | $16,932 | $21,605 | $10,723 | -$9,411 | -$14,279 | -$15,656 |
| CAPEX (M) | $16,213 | $14,259 | $18,733 | $24,844 | $25,750 | $23,944 |
| EV / EBITDA | 7.5 | 7.22 | 8.5 | 15.62 | 31.78 | -116.46 |
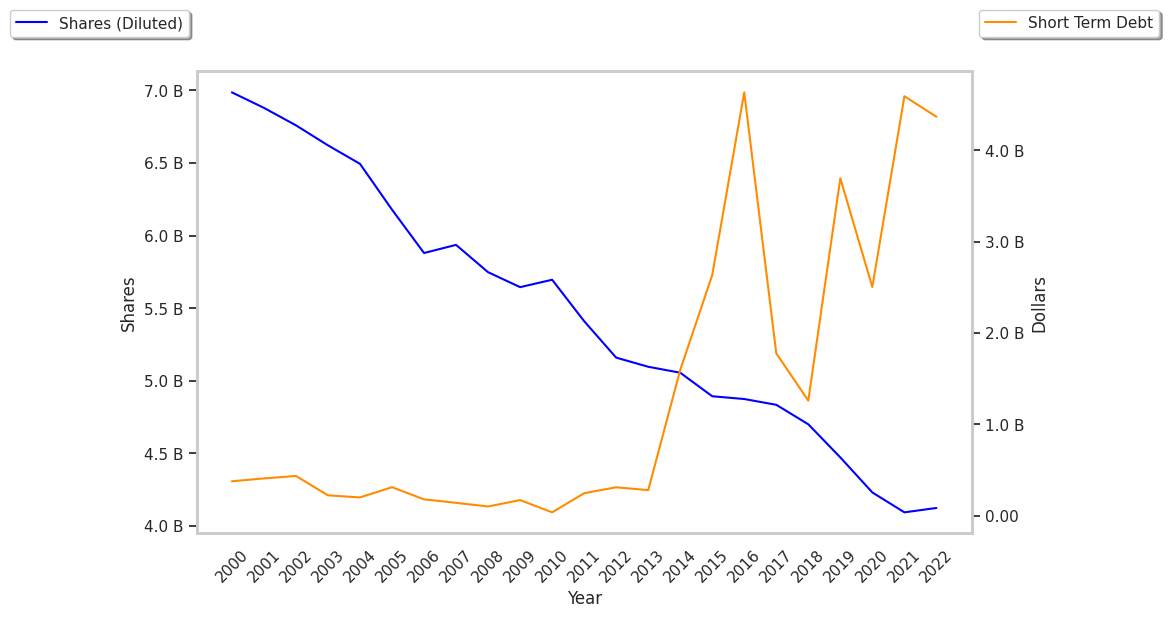
| Total Debt (M) | $32,696 | $38,905 | $42,692 | $42,474 | $51,554 | $53,740 |
| Net Debt / EBITDA | 0.91 | 0.97 | 1.29 | 2.33 | 5.6 | -26.34 |
| Current Ratio | 1.4 | 1.91 | 2.13 | 1.57 | 1.54 | 1.33 |
Intel has slimmer gross margins than its peers, declining EPS growth, and positive cash flows. On the other hand, the company has healthy debt levels working in its favor. Furthermore, Intel has declining revenues and increasing reinvestment in the business and just enough current assets to cover current liabilities, as shown by its current ratio of 1.33.