BioMarin Pharmaceutical logged a -0.5% change during today's morning session, and is now trading at a price of $55.27 per share.
BioMarin Pharmaceutical returned losses of -15.9% last year, with its stock price reaching a high of $73.51 and a low of $50.76. Over the same period, the stock underperformed the S&P 500 index by -28.9%. AThe company's 50-day average price was $53.77. BioMarin Pharmaceutical Inc., a biotechnology company, engages in the development and commercialization of therapies for life-threatening rare diseases and medical conditions in the United States, Europe, Latin America, the Middle East, the Asia Pacific, and internationally. Based in San Rafael, CA, the Large-Cap Health Care company has 3,040 full time employees. BioMarin Pharmaceutical has not offered a dividend during the last year.
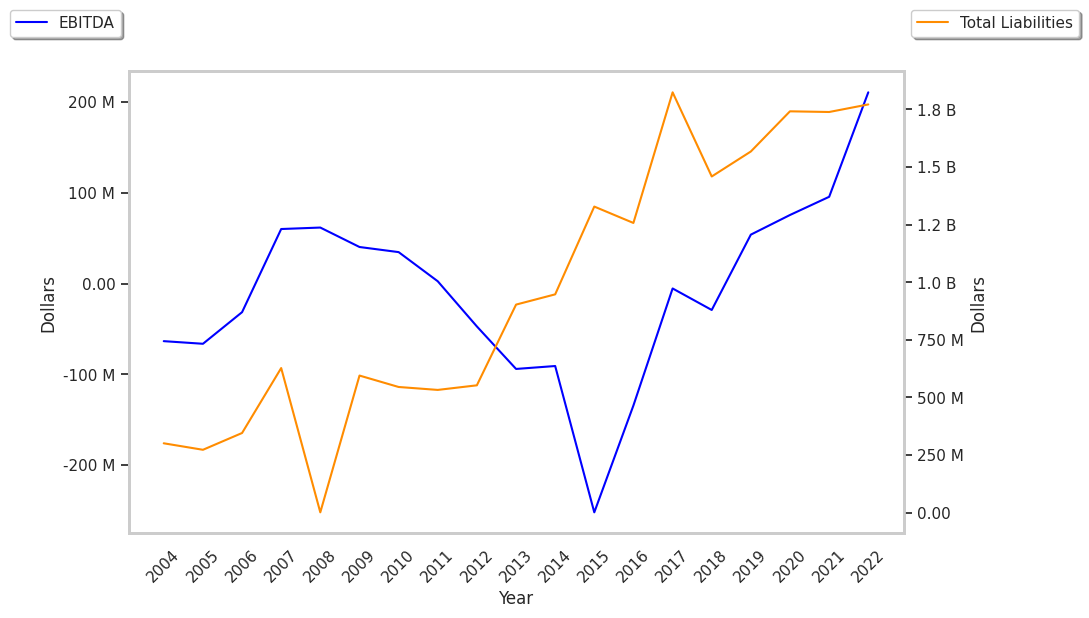
The Company May Be Profitable, but Its Balance Sheet Is Highly Leveraged:
| 2019 | 2020 | 2021 | 2022 | 2023 | 2024 | |
|---|---|---|---|---|---|---|
| Revenue (M) | $1,704 | $1,860 | $1,846 | $2,096 | $2,419 | $2,854 |
| Operating Margins | -6% | -2% | -4% | 8% | 8% | 17% |
| Net Margins | -1% | 46% | -3% | 7% | 7% | 15% |
| Net Income (M) | -$24 | $854 | -$64 | $142 | $168 | $427 |
| Net Interest Expense (M) | $23 | $29 | $15 | $16 | $17 | $10 |
| Depreciation & Amort. (M) | $105 | $105 | $108 | $102 | $104 | $47 |
| Diluted Shares (M) | 179 | 192 | 183 | 189 | 192 | 197 |
| Earnings Per Share | -$0.13 | $4.5 | -$0.35 | $0.75 | $0.87 | $2.21 |
| EPS Growth | n/a | 3561.54% | -107.78% | 314.29% | 16.0% | 154.02% |
| Avg. Price | $82.57 | $91.51 | $80.59 | $81.85 | $96.42 | $55.52 |
| P/E Ratio | -635.15 | 19.39 | -230.26 | 107.7 | 108.34 | 24.68 |
| Free Cash Flow (M) | -$97 | -$29 | $209 | $55 | $63 | $487 |
| CAPEX (M) | $145 | $114 | $96 | $121 | $97 | $85 |
| EV / EBITDA | 3125.93 | 273.62 | 589.36 | 58.65 | 63.13 | 19.08 |
| Total Debt (M) | $848 | $1,075 | $1,079 | $1,083 | $1,087 | $595 |
| Net Debt / EBITDA | 84.8 | 6.9 | 19.14 | 1.36 | 1.14 | -0.66 |
| Current Ratio | 2.08 | 4.76 | 4.16 | 4.67 | 2.51 | 5.33 |
BioMarin Pharmaceutical has exceptional EPS growth and generally positive cash flows. Additionally, the company's financial statements display an excellent current ratio of 5.33 and decent operating margins with a positive growth rate. However, the firm has a highly leveraged balance sheet. Finally, we note that BioMarin Pharmaceutical has growing revenues and decreasing reinvestment in the business.
a Lower P/B Ratio Than Its Sector Average but Priced at a Premium:
BioMarin Pharmaceutical has a trailing twelve month P/E ratio of 20.0, compared to an average of 22.94 for the Health Care sector. Based on its EPS guidance of $2.99, the company has a forward P/E ratio of 18.0. According to the 57.5% compound average growth rate of BioMarin Pharmaceutical's historical and projected earnings per share, the company's PEG ratio is 0.35. Taking the weighted average of the company's EPS CAGR and the broader market's 5-year projected EPS growth rate, we obtain a normalized growth rate of 22.6%. On this basis, the company's PEG ratio is 0.88. This suggests that its shares are undervalued. Additionally, the market is possibly undervaluing BioMarin Pharmaceutical in terms of its equity because its P/B ratio is 1.75 whereas the sector average is 3.19. The company's shares are currently trading 46.1% below their Graham number.
BioMarin Pharmaceutical Has an Analyst Consensus of Strong Upside Potential:
The 25 analysts following BioMarin Pharmaceutical have set target prices ranging from $55.0 to $122.0 per share, for an average of $89.36 with a buy rating. The company is trading -38.1% away from its average target price, indicating that there is an analyst consensus of strong upside potential.
BioMarin Pharmaceutical has an average amount of shares sold short because 6.0% of the company's shares are sold short. Institutions own 98.0% of the company's shares, and the insider ownership rate stands at 0.78%, suggesting a small amount of insider investors. The largest shareholder is Blackrock Inc., whose 11% stake in the company is worth $1,218,485,193.