Aerospace & Defense company Boeing is taking Wall Street by surprise today, falling to $217.31 and marking a -4.9% change compared to the S&P 500, which moved -1.0%. BA is -13.77% below its average analyst target price of $252.01, which implies there is more upside for the stock.
As such, the average analyst rates it at buy. Over the last year, Boeing shares have outstripped the S&P 500 by 23.0%, with a price change of 28.0%.
The Boeing Company, together with its subsidiaries, designs, develops, manufactures, sells, services, and supports commercial jetliners, military aircraft, satellites, missile defense, human space flight and launch systems, and services worldwide. The company is part of the industrials sector, which is considered cyclical. This means that sales revenues, and to some extent share prices, tend to increase during economic booms and then fall back to earth during busts. However, industrial companies can dampen this cyclical effect if they are invovled in multiple industries.
Boeing does not release its trailing 12 month P/E ratio since its earnings per share of $-7.45 are negative over the last year. But we can calculate it ourselves, which gives us a trailing P/E ratio for BA of -29.2. Based on the company's positive earnings guidance of $4.61, the stock has a forward P/E ratio of 47.1. As of the first quarter of 2023, the average Price to Earnings (P/E) ratio for US industrials companies is 20.49, and the S&P 500 has an average of 15.97. The P/E ratio consists in the stock's share price divided by its earnings per share (EPS), representing how much investors are willing to spend for each dollar of the company's earnings. Earnings are the company's revenues minus the cost of goods sold, overhead, and taxes.
One limitation P/E ratios is that they don't tell us to what extent future growth expectations are priced into Boeing market valuation. For example, a company with a low P/E ratio may not actually be a good value if it has little growth potential. On the other hand, it's possible for companies with high P/E ratios to be fairly valued in terms of their growth expectations.
Dividing Boeing's P/E ratio by its projected 5 year earnings growth rate gives us its Price to Earnings Growth (PEG) ratio of -0.99. Since it's negative, either the company's current P/E ratio or its growth rate is negative -- neither of which is a good sign.
To understand the company's long term profitability and market position, we can analyze its operating margins, which are the ratio of its net profits to its revenues. Over the last four years, Boeing's operating margins have averaged -2.0% and displayed a mean growth rate of -20.9%. These numbers show that the company may not be on the best track.
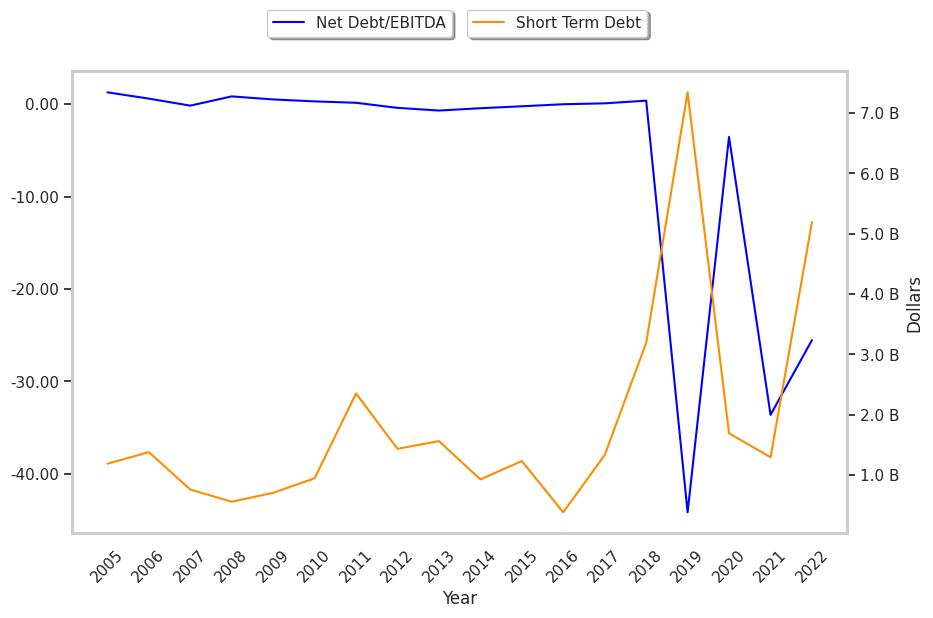
To deepen our understanding of the company's finances, we should study the effect of its depreciation and capital expenditures on the company's bottom line. We can see the effect of these additional factors in Boeing's free cash flow, which was $4.7 Billion as of its most recent annual report. Free cash flow represents the amount of money available for reinvestment in the business or for payments to equity investors in the form of a dividend. In BA's case the cash flow outlook is weak. It's average cash flow over the last 4 years has been $2.52 Billion and they've been growing at an average rate of 0.0%.
Boeing is likely overvalued at today's prices because it has a negative P/E ratio, no publishedP/B ratio, and irregular cash flows with a flat trend. The stock has poor growth indicators because of its consistently negative margins with a negative growth trend, and a negative PEG ratio. We hope this preliminary analysis will encourage you to do your own research into BA's fundamental values -- especially their trends over the last few years, which provide the clearest picture of the company's valuation.