Now trading at a price of $38.47, Freeport-McMoRan has moved -2.0% so far today.
Freeport-McMoRan returned gains of 17.0% last year, with its stock price reaching a high of $46.73 and a low of $26.03. Over the same period, the stock outperformed the S&P 500 index by 11.0%. More recently, the company's 50-day average price was $40.75. Freeport-McMoRan Inc. engages in the mining of mineral properties in North America, South America, and Indonesia. Based in Phoenix, AZ, the large-cap Basic Materials company has 25,600 full time employees. Freeport-McMoRan has offered a 1.5% dividend yield over the last 12 months.
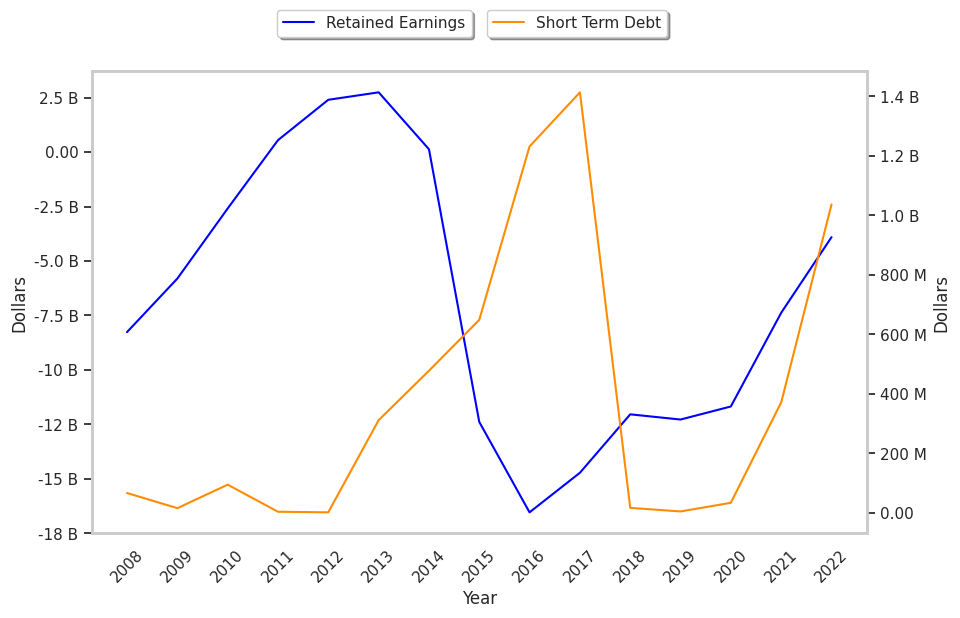
The Business Runs With Low Leverage Levels:
| 2018-02-20 | 2019-02-15 | 2020-02-14 | 2021-02-16 | 2022-02-15 | 2023-02-15 | |
|---|---|---|---|---|---|---|
| Revenue (MM) | $16,403 | $18,628 | $14,402 | $14,198 | $22,845 | $22,780 |
| Operating Margins | 23% | 25% | 5% | 15% | 37% | 31% |
| Net Margins | 11.0% | 14.0% | -2.0% | 4.0% | 19.0% | 15.0% |
| Net Income (MM) | $1,817 | $2,602 | -$239 | $599 | $4,306 | $3,468 |
| Net Interest Expense (MM) | -$801 | -$945 | -$620 | -$598 | -$602 | -$560 |
| Depreciation & Amort. (MM) | -$1,714 | -$1,754 | -$1,412 | -$1,528 | -$1,998 | -$2,019 |
| Earnings Per Share | $1.25 | $1.78 | -$0.16 | $0.41 | $2.91 | $2.39 |
| EPS Growth | n/a | 42.4% | -108.99% | 356.25% | 609.76% | -17.87% |
| Diluted Shares (MM) | 1,454 | 1,458 | 1,451 | 1,461 | 1,482 | 1,451 |
| Free Cash Flow (MM) | $6,076 | $5,834 | $2,073 | $3,048 | $8,200 | $6,771 |
| Capital Expenditures (MM) | -$1,410 | -$1,971 | -$591 | -$31 | -$485 | -$1,632 |
| Net Current Assets (MM) | -$15,380 | -$13,604 | -$15,446 | -$14,173 | -$10,173 | -$10,609 |
| Long Term Debt (MM) | $11,815 | $11,124 | $9,821 | $9,677 | $9,078 | $9,583 |
| Net Debt / EBITDA | 1.56 | 1.08 | 3.56 | 1.66 | 0.13 | 0.27 |
Freeport-McMoRan has an excellent current ratio, low leverage, and positive EPS growth. Furthermore, Freeport-McMoRan has weak revenue growth and a flat capital expenditure trend, average net margins with a positive growth rate, and irregular cash flows.
The Market May Be Overvaluing Freeport-McMoRan's Earnings and Assets:
Freeport-McMoRan has a trailing twelve month P/E ratio of 27.7, compared to an average of 10.03 for the Basic Materials sector. Based on its EPS guidance of $1.98, the company has a forward P/E ratio of 20.6. The company doesn't issue forward earnings guidance, and the compound average growth rate of its last 6 years of reported EPS is 2.7%. On this basis, the company's PEG ratio is 10.12, which suggests that it is overpriced. Furthermore, Freeport-McMoRan is likely overvalued compared to the book value of its equity, since its P/B ratio of 3.41 is higher than the sector average of 2.08. The company's shares are currently trading 26.7% above their Graham number.
Freeport-McMoRan Has an Average Rating of Buy:
The 20 analysts following Freeport-McMoRan have set target prices ranging from $26.74 to $52.55 per share, for an average of $42.15 with a buy rating. As of April 2023, the company is trading -3.3% away from its average target price, indicating that there is an analyst consensus of some upside potential.
Freeport-McMoRan has a very low short interest because 1.1% of the company's shares are sold short. Institutions own 81.0% of the company's shares, and the insider ownership rate stands at 0.57%, suggesting a small amount of insider investors. The largest shareholder is Vanguard Group Inc, whose 8% stake in the company is worth $4,580,372,874.