Now trading at a price of $96.61, LyondellBasell Industries NV has moved 0.6% so far today.
LyondellBasell Industries NV returned gains of 14.0% last year, with its stock price reaching a high of $101.3 and a low of $71.46. Over the same period, the stock outperformed the S&P 500 index by 4.0%. More recently, the company's 50-day average price was $93.85. LyondellBasell Industries N.V. operates as a chemical company in the United States, Germany, Mexico, Italy, Poland, France, Japan, China, the Netherlands, and internationally. Based in Houston, TX, the large-cap Industrials company has 19,300 full time employees. LyondellBasell Industries NV has offered a 5.0% dividend yield over the last 12 months.
Shareholders Are Confronted With a Declining EPS Growth Trend:
| 2018-02-22 | 2019-02-21 | 2020-02-20 | 2021-02-25 | 2022-02-24 | 2023-02-23 | |
|---|---|---|---|---|---|---|
| Revenue (MM) | $34,484 | $39,004 | $34,727 | $27,753 | $46,173 | $50,451 |
| Gross Margins | 19.0% | 17.0% | 16.0% | 12.0% | 19.0% | 13.0% |
| Operating Margins | 16% | 13% | 12% | 8% | 16% | 10% |
| Net Margins | 14.0% | 12.0% | 10.0% | 5.0% | 12.0% | 8.0% |
| Net Income (MM) | $4,879 | $4,688 | $3,390 | $1,420 | $5,610 | $3,882 |
| Net Interest Expense (MM) | -$467 | -$315 | -$328 | -$514 | -$510 | -$258 |
| Depreciation & Amort. (MM) | -$1,174 | -$1,241 | -$1,312 | -$1,385 | -$1,393 | -$1,267 |
| Earnings Per Share | $12.35 | $12.6 | $9.11 | $4.25 | $16.8 | $11.62 |
| EPS Growth | n/a | 2.02% | -27.7% | -53.35% | 295.29% | -30.83% |
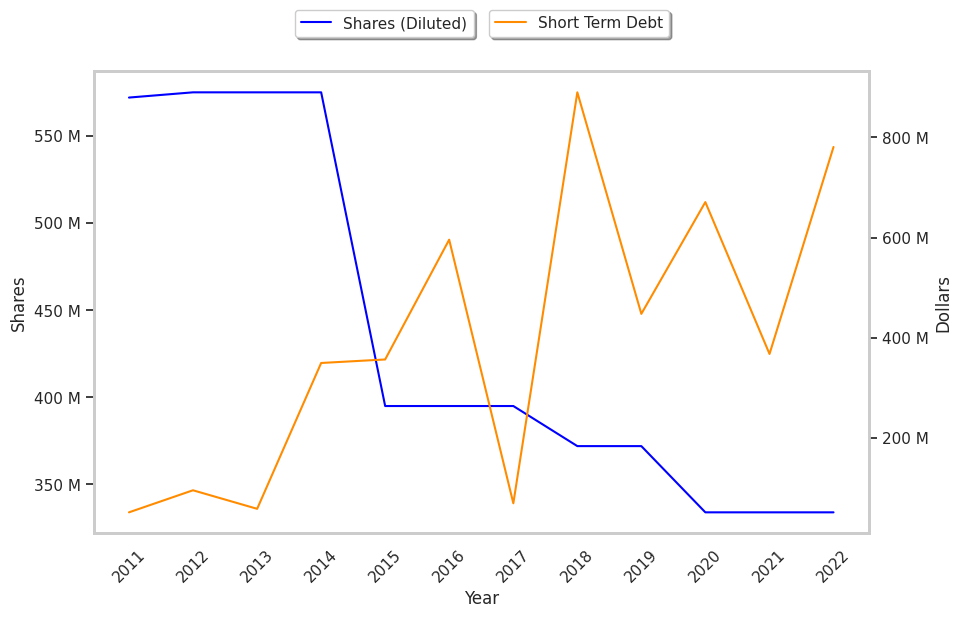
| Diluted Shares (MM) | 395 | 372 | 372 | 334 | 334 | 334 |
| Free Cash Flow (MM) | $6,753 | $7,576 | $8,182 | $5,351 | $9,654 | $8,009 |
| Capital Expenditures (MM) | -$1,547 | -$2,105 | -$2,694 | -$1,947 | -$1,959 | -$1,890 |
| Net Current Assets (MM) | -$5,518 | -$7,316 | -$12,746 | -$15,665 | -$12,537 | -$11,777 |
| Long Term Debt (MM) | $8,549 | $8,497 | $11,614 | $15,286 | $11,246 | $10,540 |
| Net Debt / EBITDA | 0.87 | 1.26 | 2.03 | 3.83 | 1.15 | 1.42 |
LyondellBasell Industries NV has weak revenue growth and a flat capital expenditure trend, irregular cash flows, and a decent current ratio. We also note that the company benefits from average operating margins with a negative growth trend and healthy leverage. However, the firm suffers from slimmer gross margins than its peers and declining EPS growth.
LyondellBasell Industries NV's Earnings and Assets May Be Undervalued:
LyondellBasell Industries NV has a trailing twelve month P/E ratio of 14.5, compared to an average of 20.49 for the Industrials sector. Based on its EPS guidance of $9.95, the company has a forward P/E ratio of 9.4. The company doesn't issue forward earnings guidance, and the compound average growth rate of its last 6 years of reported EPS is -10.2%. On this basis, the company's PEG ratio is -1.42, which indicates that its shares are overpriced. In contrast, the market is likely undervaluing LyondellBasell Industries NV in terms of its equity because its P/B ratio is 2.42 while the sector average is 3.78. The company's shares are currently trading -3.3% below their Graham number.
There's an Analyst Consensus of Some Upside Potential for LyondellBasell Industries NV:
The 22 analysts following LyondellBasell Industries NV have set target prices ranging from $85.0 to $116.0 per share, for an average of $100.19 with a hold rating. As of April 2023, the company is trading -6.3% away from its average target price, indicating that there is an analyst consensus of some upside potential.
LyondellBasell Industries NV has an average amount of shares sold short because 2.0% of the company's shares are sold short. Institutions own 72.4% of the company's shares, and the insider ownership rate stands at 20.64%, suggesting a large amount of insider shareholders. The largest shareholder is Vanguard Group Inc, whose 10% stake in the company is worth $3,024,644,838.