Comcast logged a 1.2% change during today's afternoon session, and is now trading at a price of $45.11 per share.
Comcast returned gains of 31.0% last year, with its stock price reaching a high of $47.46 and a low of $28.39. Over the same period, the stock outperformed the S&P 500 index by 18.0%. More recently, the company's 50-day average price was $44.14. Comcast Corporation operates as a media and technology company worldwide. Based in Philadelphia, PA, the large-cap Telecommunications company has 186,000 full time employees. Comcast has offered a 2.5% dividend yield over the last 12 months.
The Company May Be Profitable, but Its Balance Sheet Is Highly Leveraged:
| 2018-01-31 | 2019-01-31 | 2020-01-30 | 2021-02-04 | 2022-02-02 | 2023-02-03 | |
|---|---|---|---|---|---|---|
| Revenue (MM) | $85,029 | $94,507 | $108,942 | $103,564 | $116,385 | $121,427 |
| Gross Margins | 70.0% | 69.0% | 68.0% | 68.0% | 67.0% | 69.0% |
| Operating Margins | 21% | 20% | 19% | 17% | 18% | 19% |
| Net Margins | 27.0% | 12.0% | 12.0% | 10.0% | 12.0% | 4.0% |
| Net Income (MM) | $22,735 | $11,731 | $13,057 | $10,534 | $14,159 | $5,370 |
| Net Interest Expense (MM) | -$3,086 | -$3,542 | -$4,567 | -$4,588 | -$4,281 | -$3,896 |
| Depreciation & Amort. (MM) | -$9,688 | -$10,676 | -$12,953 | -$13,100 | -$13,804 | -$13,821 |
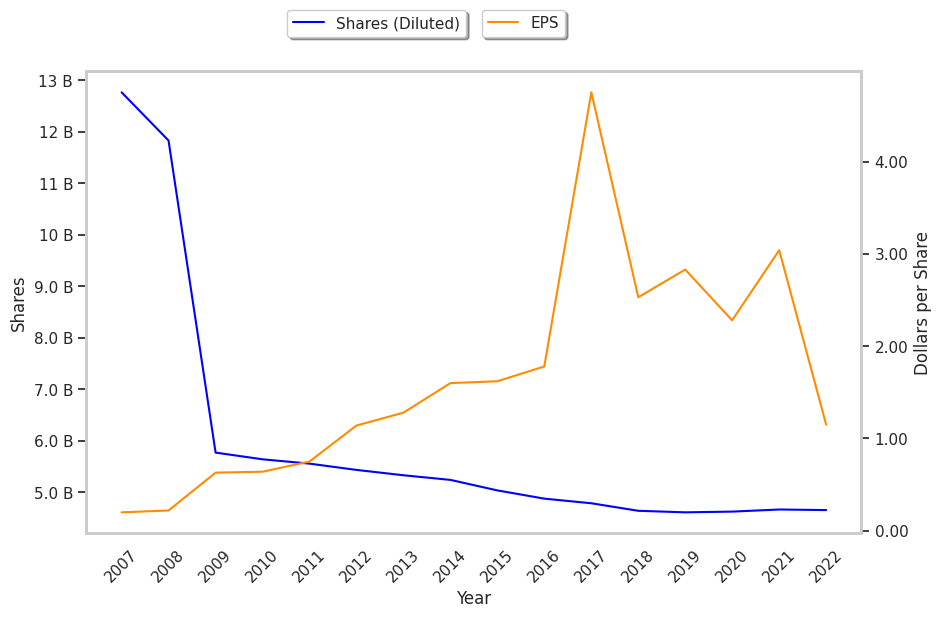
| Earnings Per Share | $4.75 | $2.53 | $2.83 | $2.28 | $3.04 | $1.15 |
| EPS Growth | n/a | -46.74% | 11.86% | -19.43% | 33.33% | -62.17% |
| Diluted Shares (MM) | 4,786 | 4,640 | 4,610 | 4,624 | 4,665 | 4,654 |
| Free Cash Flow (MM) | $32,834 | $36,006 | $38,125 | $36,371 | $41,204 | $40,180 |
| Capital Expenditures (MM) | -$11,573 | -$11,709 | -$12,428 | -$11,634 | -$12,057 | -$13,767 |
| Net Current Assets (MM) | -$100,303 | -$156,018 | -$152,776 | -$154,110 | -$153,090 | -$153,409 |
| Long Term Debt (MM) | $59,422 | $107,345 | $102,931 | $105,782 | $97,888 | $98,240 |
| Net Debt / EBITDA | 2.21 | 3.64 | 2.99 | 3.18 | 2.64 | 2.61 |
A Lower P/B Ratio Than Its Sector Average but Trades Above Its Graham Number:
Comcast has a trailing twelve month P/E ratio of 27.8, compared to an average of 18.85 for the Telecommunications sector. Based on its EPS guidance of $4.21, the company has a forward P/E ratio of 10.5. The company doesn't issue forward earnings guidance, and the compound average growth rate of its last 6 years of reported EPS is -16.7%. On this basis, the company's PEG ratio is -1.67, which indicates that its shares are overpriced. In contrast, the market is likely undervaluing Comcast in terms of its equity because its P/B ratio is 2.22 while the sector average is 3.12. The company's shares are currently trading 111.2% above their Graham number.
There's an Analyst Consensus of Some Upside Potential for Comcast:
The 28 analysts following Comcast have set target prices ranging from $39.0 to $55.0 per share, for an average of $49.09 with a buy rating. As of April 2023, the company is trading -10.1% away from its average target price, indicating that there is an analyst consensus of some upside potential.
Comcast has a very low short interest because 0.9% of the company's shares are sold short. Institutions own 87.9% of the company's shares, and the insider ownership rate stands at 0.74%, suggesting a small amount of insider investors. The largest shareholder is Vanguard Group Inc, whose 9% stake in the company is worth $17,609,146,604.