We've been asking ourselves recently if the market has placed a fair valuation on Verizon Communications. Let's dive into some of the fundamental values of this large-cap Telecommunications company to determine if there might be an opportunity here for value-minded investors.
Verizon Communications Has Attractive Multiples and Trades Below Its Graham Number:
Verizon Communications Inc., through its subsidiaries, provides communications, technology, information, and entertainment products and services to consumers, businesses, and governmental entities worldwide. The company belongs to the Telecommunications sector, which has an average price to earnings (P/E) ratio of 18.85 and an average price to book (P/B) ratio of 3.12. In contrast, Verizon Communications has a trailing 12 month P/E ratio of 6.8 and a P/B ratio of 1.51.
When we divide Verizon Communications's P/E ratio by its expected EPS growth rate of the next five years, we obtain its PEG ratio of -13.46. Since it's negative, the company has negative growth expectations, and most investors will probably avoid the stock unless it has an exceptionally low P/E and P/B ratio.
Exceptional Profitability Overshadowed by Excessive Leverage:
| 2018-02-23 | 2019-02-15 | 2020-02-21 | 2021-02-25 | 2022-02-11 | 2023-02-10 | |
|---|---|---|---|---|---|---|
| Revenue (MM) | $126,034 | $130,863 | $131,868 | $128,292 | $133,613 | $136,835 |
| Gross Margins | 57.0% | 57.0% | 57.0% | 60.0% | 57.0% | 56.0% |
| Operating Margins | 22% | 21% | 23% | 22% | 24% | 22% |
| Net Margins | 24.0% | 12.0% | 15.0% | 14.0% | 17.0% | 16.0% |
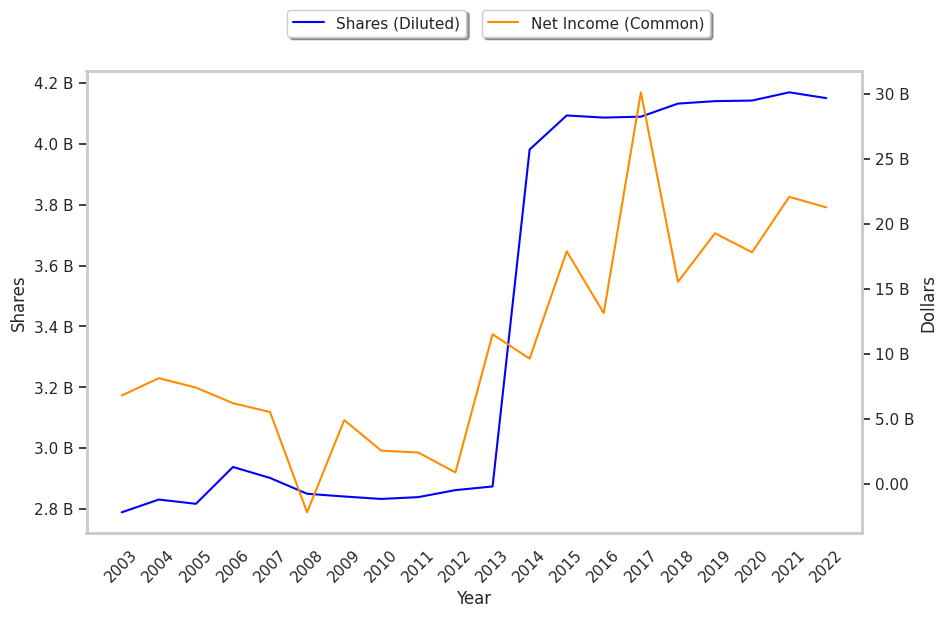
| Net Income (MM) | $30,101 | $15,528 | $19,265 | $17,801 | $22,065 | $21,256 |
| Net Interest Expense (MM) | -$4,733 | -$4,833 | -$4,730 | -$4,247 | -$3,485 | -$3,613 |
| Depreciation & Amort. (MM) | -$16,954 | -$17,403 | -$16,682 | -$16,720 | -$16,206 | -$17,099 |
| Earnings Per Share | $7.36 | $3.76 | $4.65 | $4.3 | $5.29 | $5.12 |
| EPS Growth | n/a | -48.91% | 23.67% | -7.53% | 23.02% | -3.21% |
| Diluted Shares (MM) | 4,089 | 4,132 | 4,140 | 4,142 | 4,169 | 4,150 |
| Free Cash Flow (MM) | $42,148 | $52,426 | $54,583 | $63,856 | $107,421 | $63,881 |
| Capital Expenditures (MM) | -$17,830 | -$18,087 | -$18,837 | -$22,088 | -$67,882 | -$26,740 |
| Net Current Assets (MM) | -$182,543 | -$175,483 | -$191,419 | -$192,615 | -$246,668 | -$249,360 |
| Long Term Debt (MM) | $113,642 | $105,873 | $100,712 | $123,173 | $143,425 | $140,676 |
| Net Debt / EBITDA | 2.59 | 2.49 | 2.3 | 2.35 | 3.04 | 3.11 |
Verizon Communications has slimmer gross margins than its peers, declining EPS growth, and a highly leveraged balance sheet. On the other hand, the company has strong margins with a stable trend working in its favor. Furthermore, Verizon Communications has weak revenue growth and a flat capital expenditure trend and irregular cash flows.