Based on the factors that Benjamin Graham considered in analyzing potential stock picks, Halozyme Therapeutics is not a quality investment. Only investors with a high risk tolerance and a solid investment thesis on the stock will be interested in this mid-cap Biotechnology company.
Halozyme Therapeutics Is Probably Overvalued
Graham devised the below equation to give investors a quick way of determining whether a stock is trading at a fair multiple of its earnings and its assets:
√(22.5 * 6 year average earnings per share (0.74) * 6 year average book value per share (1.145) = $6.18
At today's price of $39.3 per share, Halozyme Therapeutics is now trading 535.9% above the maximum price that Graham would have wanted to pay for the stock.
Even though the stock does not trade at an attractive multiple, it might still meet some of the other criteria for quality stocks that Graham listed in Chapter 14 of The Intelligent Investor.
Negative Retained Earnings In 2018, 2019, And 2020, No Dividend Record, and Eps Growth In Excess Of Graham'S Requirements
Ben Graham wrote that an investment in a company with a record of positive retained earnings could contribute significantly to the margin of safety. However, Halozyme Therapeutics had negative retained earnings in 2018, 2019, and 2020 with an average of $-362853945.2307692 over this period.
Another one of Graham's requirements is for a 30% or more cumulative growth rate of the company's earnings per share over the last ten years.There are only 8 years of EPS data available on Halozyme Therapeutics, which is short of the required 10, but it's still worthwhile to consider its EPS trend over the available period. First, we will average out its EPS for 2015 and 2016 which were $0.03 and $-0.81 respectively. This gives us an average of $-0.39 for the period of 2015 to 2016. Next, we compare this value with the average EPS reported in 2021 and 2022, which were $2.74 and $1.44, for an average of $2.09. Now we see that Halozyme Therapeutics's EPS growth was 635.9% during this period, which satisfies Ben Graham's requirement for growth.
We have no record of Halozyme Therapeutics offering a regular dividend.
Halozyme Therapeutics’s Balance Sheet Meets Graham’s Criteria
It was also essential to Graham that the company’s current assets outweigh its current liabilities, and that its long term debt be inferior to the sum of its net current assets (current assets minus total liabilities). This is the aspect of the analysis that most companies fail, yet Halozyme Therapeutics passes comfortably, with an average current ratio of 5.8, and average debt to net current asset ratio of -1.6.
According to Graham's analysis, Halozyme Therapeutics is likely a company of low quality, which is trading far above its fair price.
| 2018-02-20 | 2019-02-21 | 2020-02-24 | 2021-02-23 | 2022-02-22 | 2023-02-21 | |
|---|---|---|---|---|---|---|
| Revenue (k) | $316,613 | $151,862 | $195,992 | $267,594 | $443,310 | $660,116 |
| Gross Margins | 90.0% | 93.0% | 77.0% | 84.0% | 82.0% | 79.0% |
| Operating Margins | 26% | -46% | -34% | 54% | 62% | 41% |
| Net Margins | 20.0% | -53.0% | -37.0% | 48.0% | 91.0% | 31.0% |
| Net Income (k) | $62,971 | -$80,330 | -$72,240 | $129,085 | $402,710 | $202,129 |
| Net Interest Expense (k) | -$21,984 | -$18,041 | -$11,627 | -$20,378 | -$7,526 | -$16,947 |
| Depreciation & Amort. (k) | -$2,161 | -$2,388 | -$4,068 | -$3,284 | -$2,997 | -$49,641 |
| Earnings Per Share | $0.45 | -$0.56 | -$0.5 | $0.91 | $2.75 | $1.42 |
| EPS Growth | n/a | -224.44% | 10.71% | 282.0% | 202.2% | -48.36% |
| Diluted Shares (k) | 139,068 | 143,599 | 144,329 | 141,463 | 146,690 | 142,216 |
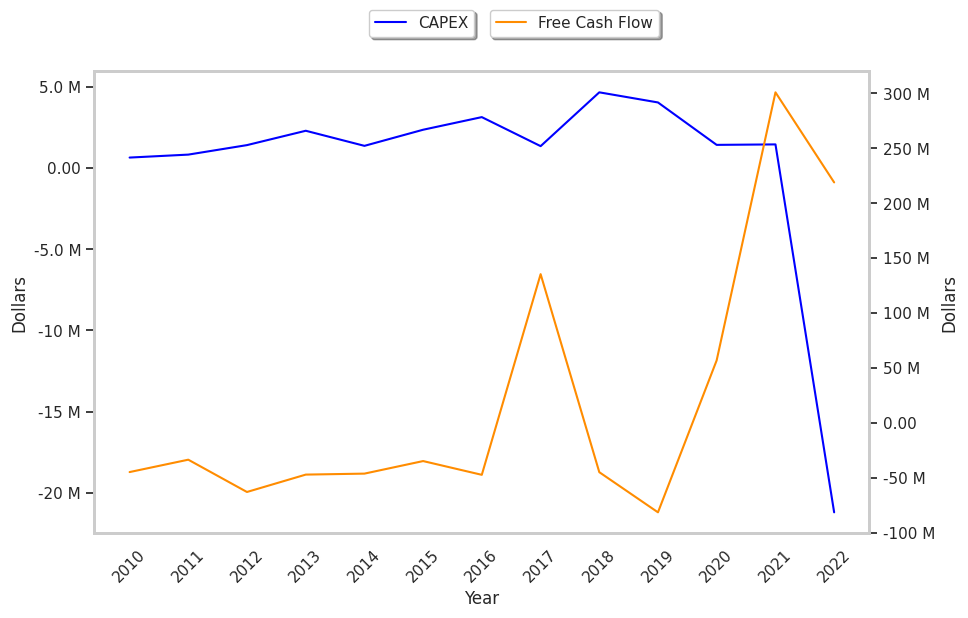
| Free Cash Flow (k) | $135,403 | -$44,837 | -$81,383 | $56,882 | $300,897 | $218,914 |
| Capital Expenditures | -$1,350 | -$4,663 | -$4,040 | -$1,428 | -$1,457 | $21,196 |
| Net Current Assets (k) | $198,793 | $236,488 | $69,327 | n/a | $32,225 | -$906,399 |
| Long Term Debt (k) | $125,140 | $34,874 | $383,045 | n/a | $787,255 | $1,492,766 |
| Net Debt / EBITDA | -3.21 | 3.41 | 0.29 | 0.2 | 0.49 | 3.6 |