Now trading at a price of $35.94, TC Energy has moved 1.3% so far today.
TC Energy returned losses of -22.0% last year, with its stock price reaching a high of $49.57 and a low of $33.02. Over the same period, the stock underperformed the S&P 500 index by -33.0%. As of April 2023, the company's 50-day average price was $37.16. TC Energy Corporation operates as an energy infrastructure company in North America. Based in Calgary, Canada, the large-cap Utilities company has 7,477 full time employees. TC Energy has offered a 10.3% dividend yield over the last 12 months.
Exceptional Profitability Overshadowed by Excessive Leverage:
| 2018-02-15 | 2019-02-14 | 2020-02-13 | 2021-02-18 | 2022-02-15 | 2023-02-14 | |
|---|---|---|---|---|---|---|
| Revenue (MM) | $13,449 | $13,679 | $13,255 | $12,999 | $13,387 | $14,977 |
| Operating Margins | 51% | 52% | 46% | 45% | 45% | 44% |
| Net Margins | 23.0% | 27.0% | 31.0% | 36.0% | 15.0% | 5.0% |
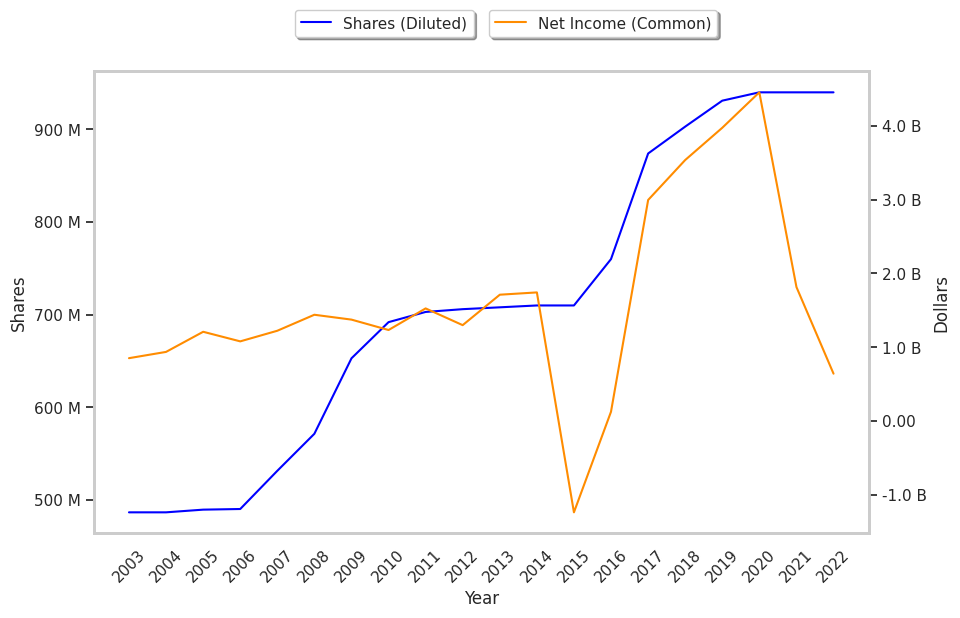
| Net Income (MM) | $3,157 | $3,702 | $4,140 | $4,616 | $1,955 | $748 |
| Net Interest Expense (MM) | -$1,885 | -$2,341 | -$1,873 | -$2,043 | -$2,170 | -$2,442 |
| Depreciation & Amort. (MM) | -$2,055 | -$2,350 | -$2,464 | -$2,590 | -$2,522 | -$2,584 |
| Earnings Per Share | $3.43 | $3.92 | $4.27 | $4.74 | $1.93 | $0.68 |
| EPS Growth | n/a | 14.29% | 8.93% | 11.01% | -59.28% | -64.77% |
| Diluted Shares (MM) | 874 | 903 | 931 | 940 | 940 | 940 |
| Free Cash Flow (MM) | $8,076 | $15,855 | $12,866 | $11,786 | $12,779 | $13,673 |
| Capital Expenditures (MM) | -$2,846 | -$9,300 | -$5,784 | -$4,728 | -$5,889 | -$6,727 |
| Net Current Assets (MM) | -$54,530 | -$62,792 | -$59,231 | -$61,626 | -$63,399 | -$72,900 |
| Long Term Debt (MM) | $38,882 | $44,017 | $42,894 | $43,411 | $46,280 | $50,140 |
| Net Debt / EBITDA | 4.73 | 5.23 | 5.64 | 5.72 | 6.12 | 6.27 |
TC Energy's Valuation Is in Line With Its Sector Averages:
TC Energy has a trailing twelve month P/E ratio of 56.3, compared to an average of 22.89 for the Utilities sector. Based on its EPS guidance of $3.0, the company has a forward P/E ratio of 12.4. The company doesn't issue forward earnings guidance, and the compound average growth rate of its last 6 years of reported EPS is -24.0%. On this basis, the company's PEG ratio is -2.34, which indicates that its shares are overpriced. Furthermore, TC Energy is likely overvalued compared to the book value of its equity, since its P/B ratio of 1.18 is higher than the sector average of 1.03. The company's shares are currently trading 52.6% above their Graham number.
TC Energy Has an Analyst Consensus of Some Upside Potential:
The 7 analysts following TC Energy have set target prices ranging from $34.98 to $71.97 per share, for an average of $44.3 with a hold rating. As of April 2023, the company is trading -16.1% away from its average target price, indicating that there is an analyst consensus of some upside potential.
The largest shareholder is Royal Bank of Canada, whose 10% stake in the company is worth $3,681,271,597.