One of the biggest losers as of today's evening session is software company Oracle, whose shares are down -13.5%, underperforming the Nasdaq by -13.0%.
At $109.6, ORCL is 14.64% below its average analyst target price of $128.4.
The average analyst rating for the stock is buy. ORCL underperformed the S&P 500 by -13.0% so far today, but outpaced the index by 30.0% over the last year with a return of 45.0%.
Oracle's trailing 12 month P/E ratio is 35.7, based on its trailing EPS of $3.07. The company has a forward P/E ratio of 17.4 according to its forward EPS of $6.3 -- which is an estimate of what its earnings will look like in the next quarter. As of the first quarter of 2023, the average Price to Earnings (P/E) ratio of US technology companies is 27.16, and the S&P 500 average is 15.97. The P/E ratio consists in the stock's share price divided by its earnings per share (EPS), representing how much investors are willing to spend for each dollar of the company's earnings. Earnings are the company's revenues minus the cost of goods sold, overhead, and taxes.
We can take the price to earnings analysis one step further by dividing the P/E ratio by the company’s projected five-year growth rate, which gives us its Price to Earnings Growth, or PEG ratio. This ratio is important because it allows us to identify companies that have a low price to earnings ratio because of low growth expectations, or conversely, companies with high P/E ratios because growth is expected to take off.
Oracle's PEG ratio of 1.99 indicates that its P/E ratio is fair compared to its projected earnings growth. In other words, the company’s valuation accurately reflects its estimated growth potential. The caveat, however, is that these growth estimates could turn out to be inaccurate.
To better understand the strength of Oracle's business, we can analyse its operating margins, which are its revenues minues its operating costs. Consistently strong margins backed by a positive trend can signal that a company is on track to deliver returns for its shareholders. Here's the operating margin statistics for the last four years:
| Date Reported | Total Revenue ($ k) | Operating Expenses ($ k) | Operating Margins (%) | YoY Growth (%) |
|---|---|---|---|---|
| 2022-06-21 | 42,440,000 | -17,733,000 | 37 | -5.13 |
| 2021-06-21 | 40,479,000 | -16,842,000 | 39 | 8.33 |
| 2020-06-22 | 39,068,000 | -16,928,000 | 36 | 2.86 |
| 2019-06-21 | 39,506,000 | -17,489,000 | 35 | 0.0 |
| 2018-06-22 | 39,383,000 | -17,419,000 | 35 | -2.78 |
| 2017-06-27 | 37,792,000 | -16,861,000 | 36 |
- Average operating margins: 36.3%
- Average operating margins growth rate: 0.6%
- Coefficient of variability (lower numbers indicate less volatility): 4.1%
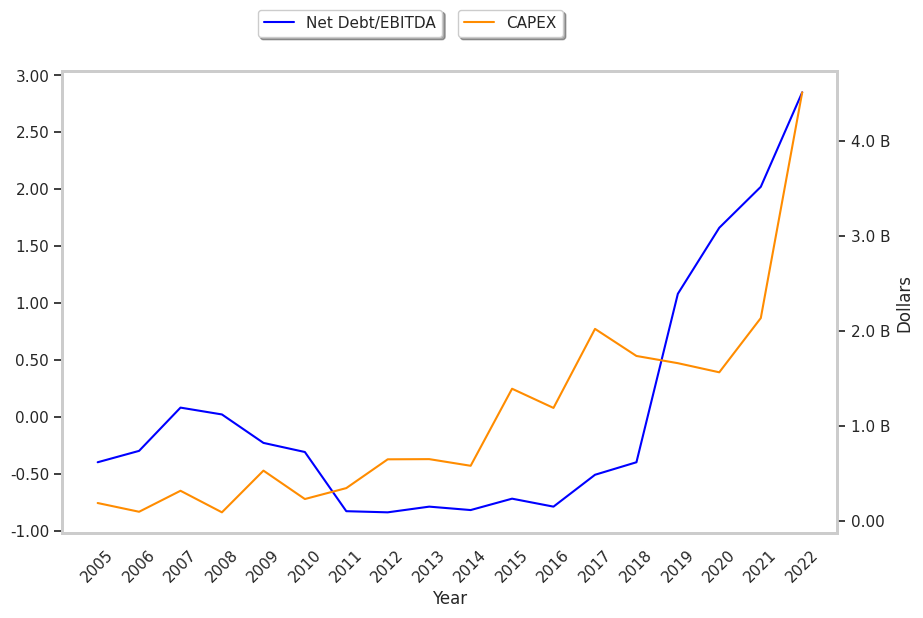
Oracle's financial viability can also be assessed through a review of its free cash flow trends. Free cash flow refers to its operating cash flows minues its capital expenditures, which are expenses related to the maintenance of fixed assets such as land, infrastructure, and equipment. Over the last four years, the trends have been as follows:
| Date Reported | Cash Flow from Operations ($ k) | Capital expenditures ($ k) | Free Cash Flow ($ k) | YoY Growth (%) |
|---|---|---|---|---|
| 2022-06-21 | 9,539,000 | -4,511,000 | 14,050,000 | -22.04 |
| 2021-06-21 | 15,887,000 | -2,135,000 | 18,022,000 | 22.57 |
| 2020-06-22 | 13,139,000 | -1,564,000 | 14,703,000 | -9.3 |
| 2019-06-21 | 14,551,000 | -1,660,000 | 16,211,000 | -5.32 |
| 2018-06-22 | 15,386,000 | -1,736,000 | 17,122,000 | 6.04 |
| 2017-06-27 | 14,126,000 | -2,021,000 | 16,147,000 |
- Average free cash flow: $16.04 Billion
- Average free cash flow growth rate: 0.0%
- Coefficient of variability (lower numbers indicating more stability): 109984592248.2%
With its positive cash flow, the company can not only re-invest in its business, it can offer regular returns to its equity investors in the form of dividends. Over the last 12 months, investors in ORCL have received an annualized dividend yield of 1.1% on their capital.
Another valuation metric for analyzing a stock is its Price to Book (P/B) Ratio, which consists in its share price divided by its book value per share. The book value refers to the present liquidation value of the company, as if it sold all of its assets and paid off all debts. As of the first quarter of 2023, the average P/B ratio for technology companies is 6.23. In contrast, the average P/B ratio of the S&P 500 is 2.95. Oracle's P/B ratio indicates that the market value of the company exceeds its book value by a factor of 276, so it's likely that equity investors are over-valuing the company's assets.
As of first quarter of 2023, Oracle is likely overvalued because it has an inflated P/E ratio, an elevated P/B ratio, and irregular cash flows with a flat trend. The stock has mixed growth prospects because of its strong margins with a stable trend, and an inflated PEG ratio. We hope this analysis will inspire you to do your own research into ORCL's fundamental values -- especially their trends over time.