We've been asking ourselves recently if the market has placed a fair valuation on Tesla. Let's dive into some of the fundamental values of this large-cap Consumer Discretionary company to determine if there might be an opportunity here for value-minded investors.
The Market May Be Overvaluing Tesla's Earnings and Assets:
Tesla, Inc. designs, develops, manufactures, leases, and sells electric vehicles, and energy generation and storage systems in the United States, China, and internationally. The company belongs to the Consumer Discretionary sector, which has an average price to earnings (P/E) ratio of 22.33 and an average price to book (P/B) ratio of 3.12. In contrast, Tesla has a trailing 12 month P/E ratio of 71.0 and a P/B ratio of 17.02.
Tesla's PEG ratio is 7.51, which shows that the stock is probably overvalued in terms of its estimated growth. For reference, a PEG ratio near or below 1 is a potential signal that a company is undervalued.
The Company Has a Positive Net Current Asset Value:
| 2018-02-23 | 2019-02-19 | 2020-04-28 | 2021-02-08 | 2022-02-07 | 2023-01-31 | |
|---|---|---|---|---|---|---|
| Revenue (MM) | $11,759 | $21,461 | $24,578 | $31,536 | $53,823 | $81,462 |
| Gross Margins | 19.0% | 19.0% | 17.0% | 21.0% | 25.0% | 26.0% |
| Operating Margins | -14% | -1% | 0% | 6% | 12% | 17% |
| Net Margins | -17.0% | -5.0% | -4.0% | 2.0% | 10.0% | 15.0% |
| Net Income (MM) | -$1,961 | -$976 | -$862 | $721 | $5,519 | $12,556 |
| Net Interest Expense (MM) | -$452 | -$639 | -$641 | -$718 | -$315 | $106 |
| Depreciation & Amort. (MM) | -$1,636 | -$1,901 | -$2,154 | -$2,322 | -$2,911 | -$3,747 |
| Earnings Per Share | -$0.79 | -$0.38 | -$0.32 | $0.22 | $1.64 | $3.71 |
| EPS Growth | n/a | 51.9% | 15.79% | 168.75% | 645.45% | 126.22% |
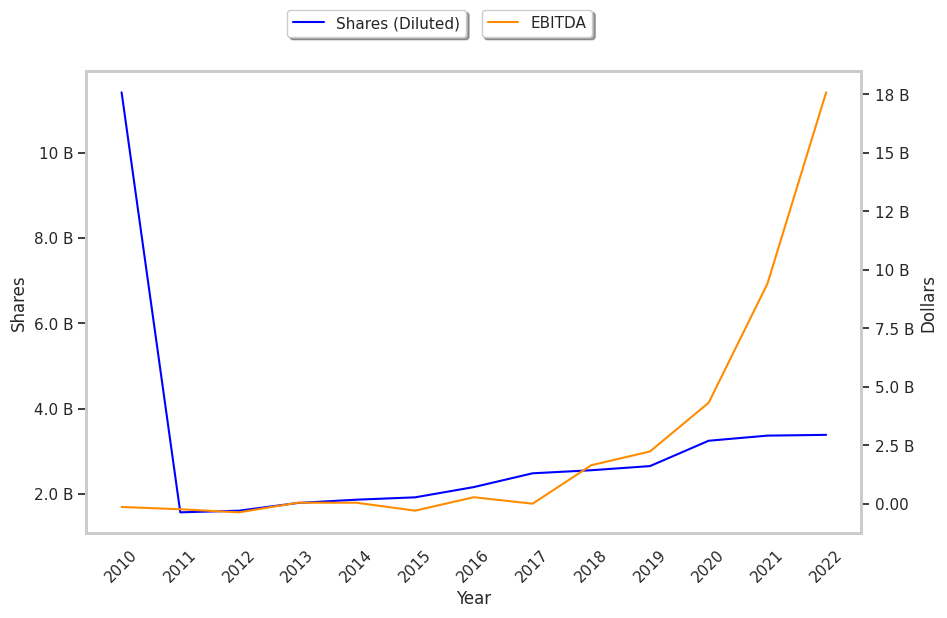
| Diluted Shares (MM) | 2,486 | 2,558 | 2,655 | 3,249 | 3,369 | 3,387 |
| Free Cash Flow (MM) | $4,021 | $4,417 | $3,842 | $9,185 | $18,011 | $21,896 |
| Capital Expenditures (MM) | -$4,081 | -$2,319 | -$1,437 | -$3,242 | -$6,514 | -$7,172 |
| Net Current Assets (MM) | -$16,452 | -$15,120 | -$14,096 | -$1,701 | -$3,448 | $4,477 |
| Long Term Debt (MM) | $9,418 | $9,404 | $11,634 | $9,556 | $5,245 | $1,597 |
| Net Debt / EBITDA | 1773.54 | 5.03 | 3.2 | -1.78 | -1.16 | -1.09 |
Tesla has exceptional EPS growth, a pattern of improving cash flows, and wider gross margins than its peer group. However, the firm suffers from weak operating margins with a positive growth rate and a highly leveraged balance sheet. Finally, we note that Tesla has weak revenue growth and a flat capital expenditure trend and just enough current assets to cover current liabilities.