We've been asking ourselves recently if the market has placed a fair valuation on Adobe. Let's dive into some of the fundamental values of this large-cap Technology company to determine if there might be an opportunity here for value-minded investors.
The Market May Be Overvaluing Adobe's Earnings and Assets:
Adobe Inc., together with its subsidiaries, operates as a diversified software company worldwide. The company belongs to the Technology sector, which has an average price to earnings (P/E) ratio of 27.16 and an average price to book (P/B) ratio of 6.23. In contrast, Adobe has a trailing 12 month P/E ratio of 54.7 and a P/B ratio of 16.95.
Adobe's PEG ratio is 2.5, which shows that the stock is probably overvalued in terms of its estimated growth. For reference, a PEG ratio near or below 1 is a potential signal that a company is undervalued.
The Business Has Operating Margins Consistently Higher Than the 21.81% industry Average:
| 2018-01-22 | 2019-01-25 | 2020-01-21 | 2021-01-15 | 2022-01-21 | 2023-01-17 | |
|---|---|---|---|---|---|---|
| Revenue (MM) | $7,302 | $9,030 | $11,171 | $12,868 | $15,785 | $17,606 |
| Operating Margins | 30% | 31% | 28% | 33% | 37% | 35% |
| Net Margins | 23.0% | 28.0% | 26.0% | 41.0% | 31.0% | 27.0% |
| Net Income (MM) | $1,694 | $2,591 | $2,951 | $5,260 | $4,822 | $4,756 |
| Net Interest Expense (MM) | -$74 | -$89 | -$157 | -$116 | -$113 | -$112 |
| Depreciation & Amort. (MM) | -$326 | -$346 | -$757 | -$757 | -$788 | -$856 |
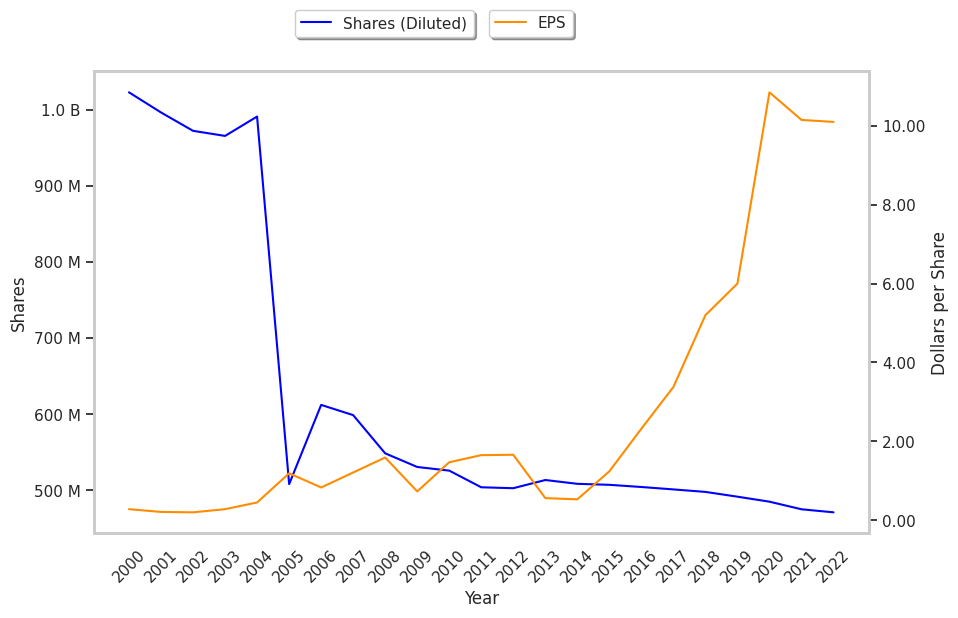
| Earnings Per Share | $3.38 | $5.2 | $6.0 | $10.85 | $10.15 | $10.1 |
| EPS Growth | n/a | 53.85% | 15.38% | 80.83% | -6.45% | -0.49% |
| Diluted Shares (MM) | 501 | 498 | 492 | 485 | 475 | 471 |
| Free Cash Flow (MM) | $3,089 | $4,296 | $4,817 | $6,146 | $7,578 | $8,280 |
| Capital Expenditures (MM) | -$176 | -$267 | -$395 | -$419 | -$348 | -$442 |
| Net Current Assets (MM) | $1,172 | -$4,550 | -$3,737 | -$2,874 | -$3,775 | -$4,118 |
| Long Term Debt (MM) | $1,881 | $4,125 | $989 | $4,117 | $4,123 | $3,629 |
| Net Debt / EBITDA | -1.58 | 0.28 | -0.01 | -0.38 | -0.25 | -0.28 |
Adobe has strong margins with a stable trend and a pattern of improving cash flows. Additionally, the company's financial statements display low leverage and a strong EPS growth trend. Furthermore, Adobe has weak revenue growth and a flat capital expenditure trend and just enough current assets to cover current liabilities.