It's been a great afternoon session for International Paper Company investors, who saw their shares rise 2.0% to a price of $34.48 per share. At these higher prices, is the company still fairly valued? If you are thinking about investing, make sure to check the company's fundamentals before making a decision.
The Market May Be Undervaluing International Paper Company's Assets and Equity:
International Paper Company produces renewable fiber-based packaging and pulp products in North America, Latin America, Europe, and North Africa. The company belongs to the Basic Materials sector, which has an average price to earnings (P/E) ratio of 10.03 and an average price to book (P/B) ratio of 2.08. In contrast, International Paper Company has a trailing 12 month P/E ratio of 8.5 and a P/B ratio of 1.42.
When we divideInternational Paper Company's P/E ratio by its expected five-year EPS growth rate, we obtain a PEG ratio of 0.82, which indicates that the market is undervaluing the company's projected growth (a PEG ratio of 1 indicates a fairly valued company). Your analysis of the stock shouldn't end here. Rather, a good PEG ratio should alert you that it may be worthwhile to take a closer look at the stock.
The Company Has a Highly Leveraged Balance Sheet and a Declining EPS Growth Trend:
| 2018-02-22 | 2019-02-20 | 2020-02-19 | 2021-02-19 | 2022-02-18 | 2023-02-17 | |
|---|---|---|---|---|---|---|
| Revenue (MM) | $21,743 | $23,306 | $18,317 | $17,565 | $19,363 | $21,161 |
| Gross Margins | 32.0% | 33.0% | 31.0% | 30.0% | 28.0% | 28.0% |
| Operating Margins | 8% | 13% | 10% | 8% | 8% | 8% |
| Net Margins | 10.0% | 9.0% | 7.0% | 3.0% | 9.0% | 7.0% |
| Net Income (MM) | $2,144 | $2,012 | $1,225 | $482 | $1,752 | $1,504 |
| Net Interest Expense (MM) | -$572 | -$536 | -$499 | -$446 | -$337 | -$325 |
| Depreciation & Amort. (MM) | -$1,423 | -$1,328 | -$1,306 | -$1,287 | -$1,210 | -$1,040 |
| Earnings Per Share | $4.86 | $4.6 | $2.91 | $1.15 | $4.46 | $3.83 |
| EPS Growth | n/a | -5.35% | -36.74% | -60.48% | 287.83% | -14.13% |
| Diluted Shares (MM) | 441 | 437 | 421 | 418 | 393 | 392 |
| Free Cash Flow (MM) | $2,989 | $4,775 | $4,868 | $3,055 | $1,929 | $2,161 |
| Capital Expenditures (MM) | -$1,365 | -$1,549 | -$1,258 | $8 | $101 | $13 |
| Net Current Assets (MM) | -$19,085 | -$19,197 | -$19,114 | -$12,614 | -$9,065 | -$8,673 |
| Long Term Debt (MM) | $17,137 | $16,313 | $11,986 | $10,390 | $7,718 | $7,205 |
| Net Debt / EBITDA | 5.03 | 3.81 | 5.2 | 5.35 | 2.38 | 2.56 |
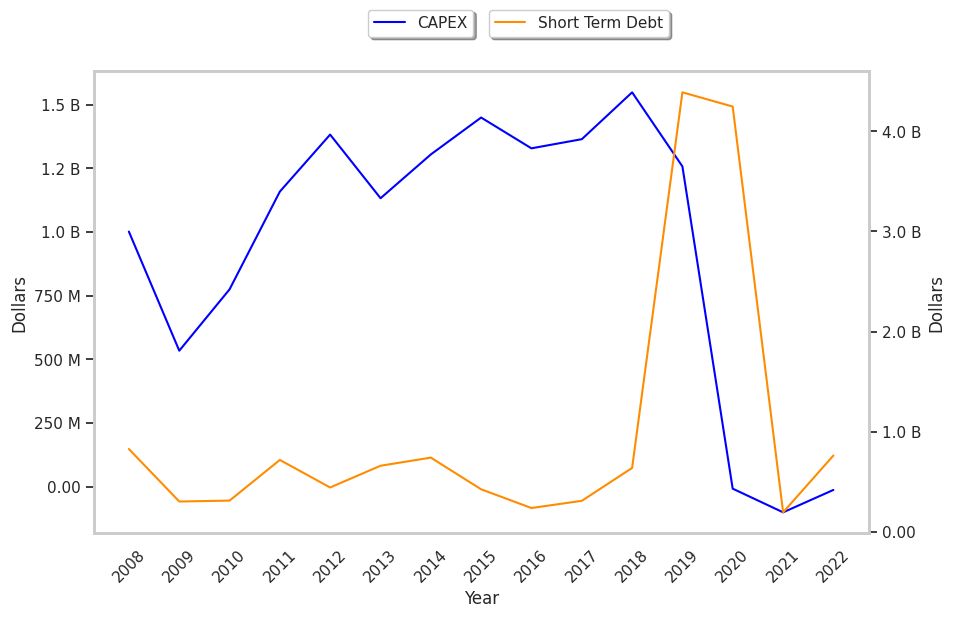
International Paper Company has slimmer gross margins than its peers, declining EPS growth, and a highly leveraged balance sheet. International Paper Company has weak revenue growth and a flat capital expenditure trend, weak operating margings with a stable trend, and irregular cash flows. In addition, we note just enough current assets to cover current liabilities.