Visa shares fell by -2.3% during the day's afternoon session, and are now trading at a price of $242.17. Is it time to buy the dip? To better answer that question, it's essential to check if the market is valuing the company's shares fairly in terms of its earnings and equity levels.
Visa's P/B and P/E Ratios Are Higher Than Average:
Visa Inc. operates as a payments technology company worldwide. The company belongs to the Consumer Discretionary sector, which has an average price to earnings (P/E) ratio of 22.33 and an average price to book (P/B) ratio of 3.12. In contrast, Visa has a trailing 12 month P/E ratio of 30.7 and a P/B ratio of 13.26.
Visa's PEG ratio is 1.95, which shows that the stock is probably overvalued in terms of its estimated growth. For reference, a PEG ratio near or below 1 is a potential signal that a company is undervalued.
Low Leverage Levels and Exceptional EPS Growth:
| 2017-11-17 | 2018-11-16 | 2019-11-14 | 2020-11-19 | 2021-11-18 | 2022-11-16 | |
|---|---|---|---|---|---|---|
| Revenue (MM) | $18,358 | $20,609 | $22,977 | $21,846 | $24,105 | $29,310 |
| Operating Margins | 66% | 63% | 67% | 68% | 69% | 70% |
| Net Margins | 36.0% | 50.0% | 53.0% | 50.0% | 51.0% | 51.0% |
| Net Income (MM) | $6,699 | $10,301 | $12,080 | $10,866 | $12,311 | $14,957 |
| Net Interest Expense (MM) | -$563 | -$612 | -$533 | -$516 | -$513 | -$538 |
| Depreciation & Amort. (MM) | -$5,121 | -$6,104 | -$656 | -$767 | -$804 | -$861 |
| Earnings Per Share | $2.35 | $3.7 | $4.43 | $4.07 | $5.7 | $6.84 |
| EPS Growth | n/a | 57.45% | 19.73% | -8.13% | 40.05% | 20.0% |
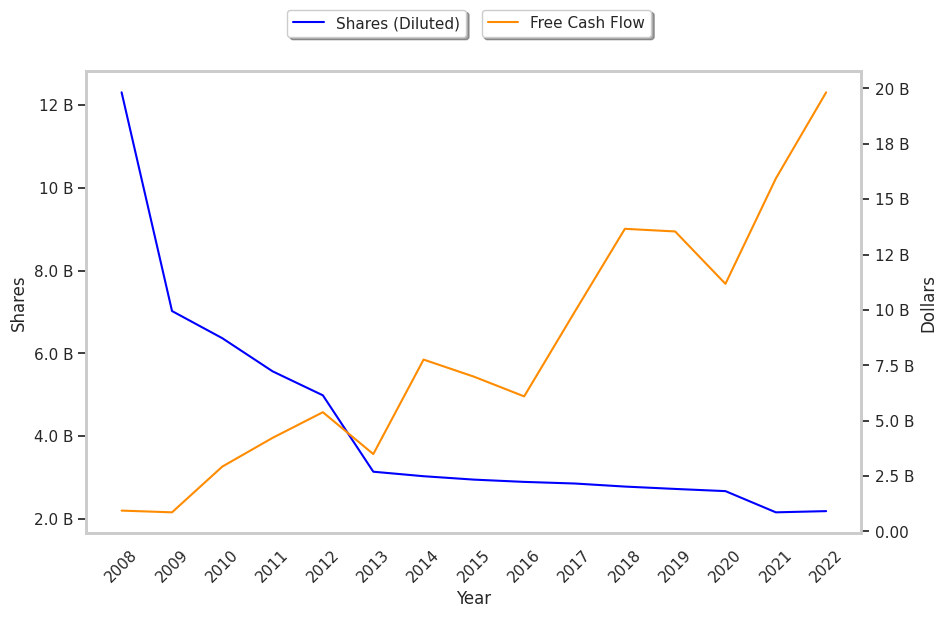
| Diluted Shares (MM) | 2,855 | 2,781 | 2,724 | 2,671 | 2,159 | 2,188 |
| Free Cash Flow (MM) | $9,903 | $13,659 | $13,540 | $11,176 | $15,932 | $19,819 |
| Capital Expenditures (MM) | -$695 | -$718 | -$756 | -$736 | -$705 | -$970 |
| Net Current Assets (MM) | -$16,194 | -$17,003 | -$16,920 | -$17,064 | -$17,700 | -$19,715 |
| Long Term Debt (MM) | $16,618 | $16,630 | $16,729 | $21,071 | $19,978 | $20,200 |
| Net Debt / EBITDA | 0.37 | 0.26 | 0.36 | 0.26 | 0.14 | 0.18 |
Visa has strong margins with a stable trend, exceptional EPS growth, and low leverage. Furthermore, Visa has weak revenue growth and a flat capital expenditure trend, irregular cash flows, and just enough current assets to cover current liabilities.