Now trading at a price of $129.94, Builders FirstSource has moved 2.1% so far today.
Builders FirstSource returned gains of 127.0% last year, with its stock price reaching a high of $156.85 and a low of $52.7. Over the same period, the stock outperformed the S&P 500 index by 112.0%. More recently, the company's 50-day average price was $140.81. Builders FirstSource, Inc., together with its subsidiaries, manufactures and supplies building materials, manufactured components, and construction services to professional homebuilders, sub-contractors, remodelers, and consumers in the United States. Based in Irving, TX, the large-cap Consumer Discretionary company has 29,000 full time employees. Builders FirstSource has not offered a dividend during the last year.
The Business Has Weak Operating Margins:
| 2018-03-01 | 2019-03-01 | 2020-02-21 | 2021-02-26 | 2022-03-01 | 2023-02-28 | |
|---|---|---|---|---|---|---|
| Revenue (MM) | $7,034 | $7,725 | $7,280 | $8,559 | $19,894 | $22,726 |
| Gross Margins | 25.0% | 25.0% | 27.0% | 26.0% | 28.0% | 34.0% |
| Operating Margins | 4% | 5% | 5% | 6% | 12% | 17% |
| Net Margins | 1.0% | 3.0% | 3.0% | 4.0% | 9.0% | 12.0% |
| Net Income (MM) | $39 | $205 | $222 | $314 | $1,725 | $2,749 |
| Net Interest Expense (MM) | -$193 | -$108 | -$110 | -$136 | -$136 | -$198 |
| Depreciation & Amort. (MM) | -$93 | -$98 | -$100 | -$117 | -$547 | -$497 |
| Earnings Per Share | $0.34 | $1.76 | $1.9 | $2.66 | $8.39 | $16.82 |
| EPS Growth | n/a | 417.65% | 7.95% | 40.0% | 215.41% | 100.48% |
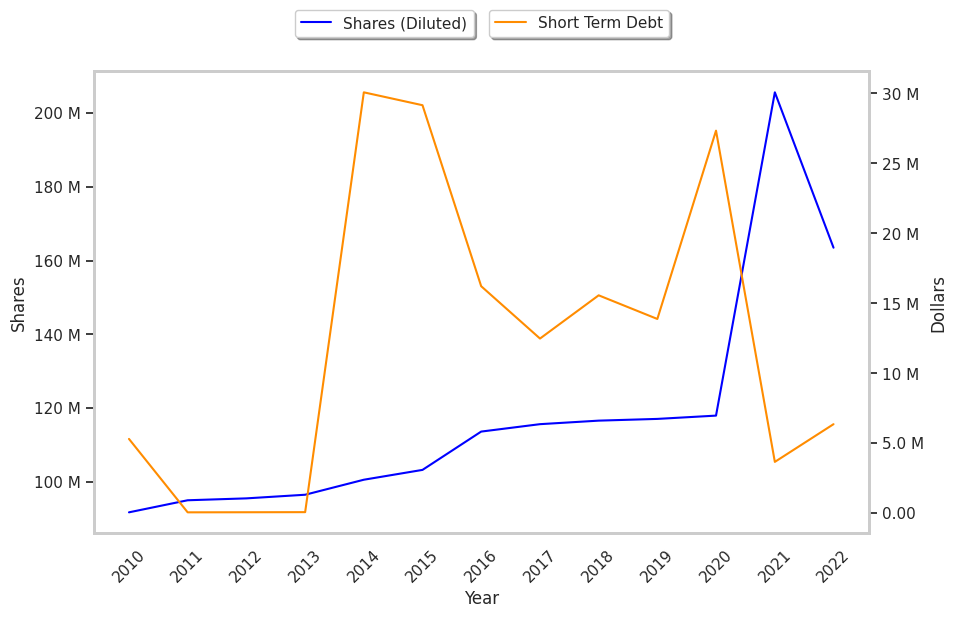
| Diluted Shares (MM) | 116 | 117 | 117 | 118 | 206 | 163 |
| Free Cash Flow (MM) | $238 | $379 | $610 | $364 | $1,958 | $3,929 |
| Capital Expenditures (MM) | -$59 | -$97 | -$106 | -$104 | -$214 | -$329 |
| Net Current Assets (MM) | -$1,234 | -$962 | -$1,118 | -$797 | -$1,944 | -$2,135 |
| Long Term Debt (MM) | $1,772 | $1,546 | $1,277 | $1,597 | $2,926 | $2,978 |
| Net Debt / EBITDA | 4.57 | 3.32 | 2.59 | 1.82 | 0.98 | 0.68 |
Builders FirstSource has weak revenue growth and a flat capital expenditure trend, irregular cash flows, and a decent current ratio. We also note that the company benefits from exceptional EPS growth and healthy leverage. However, the firm suffers from slimmer gross margins than its peers and weak operating margins with a positive growth rate.
A Very Low P/E Ratio but Trades Above Its Graham Number:
Builders FirstSource has a trailing twelve month P/E ratio of 11.3, compared to an average of 22.33 for the Consumer Discretionary sector. Based on its EPS guidance of $11.98, the company has a forward P/E ratio of 11.8. The company doesn't provide forward earnings guidance, and the compound average growth rate of its last 6 years of reported EPS is 82.1%. On this basis, Builders FirstSource's PEG ratio is 0.14. Using instead the 11.6% weighted average of Builders FirstSource's earnings CAGR and the broader market's anticipated 5-year EPS growth rate, the company's PEG ratio is 0.98, which implies that its shares may be underpriced. In contrast, Builders FirstSource is likely overvalued compared to the book value of its equity, since its P/B ratio of 3.74 is higher than the sector average of 3.12. The company's shares are currently trading 21.2% above their Graham number.
Builders FirstSource Has an Average Rating of Buy:
The 15 analysts following Builders FirstSource have set target prices ranging from $135.0 to $220.0 per share, for an average of $172.8 with a buy rating. As of April 2023, the company is trading -18.5% away from its average target price, indicating that there is an analyst consensus of strong upside potential.
Builders FirstSource has an average amount of shares sold short because 5.2% of the company's shares are sold short. Institutions own 103.5% of the company's shares, and the insider ownership rate stands at 1.92%, suggesting a large amount of insider shareholders. The largest shareholder is Blackrock Inc., whose 12% stake in the company is worth $1,953,073,867.