It hasn't been a great afternoon session for Deere & Company investors, who have watched their shares sink by -1.1% to a price of $383.26. Some of you might be wondering if it's time to buy the dip. If you are considering this, make sure to check the company's fundamentals first to determine if the shares are fairly valued at today's prices.
A Very Low P/E Ratio but Trades Above Its Graham Number:
Deere & Company manufactures and distributes various equipment worldwide. The company belongs to the Industrials sector, which has an average price to earnings (P/E) ratio of 20.49 and an average price to book (P/B) ratio of 3.78. In contrast, Deere & Company has a trailing 12 month P/E ratio of 11.4 and a P/B ratio of 4.79.
When we divideDeere & Company's P/E ratio by its expected five-year EPS growth rate, we obtain a PEG ratio of 0.81, which indicates that the market is undervaluing the company's projected growth (a PEG ratio of 1 indicates a fairly valued company). Your analysis of the stock shouldn't end here. Rather, a good PEG ratio should alert you that it may be worthwhile to take a closer look at the stock.
The Company May Be Profitable, but Its Balance Sheet Is Highly Leveraged:
| 2017-12-18 | 2018-12-17 | 2019-12-19 | 2020-12-17 | 2021-12-16 | 2022-12-15 | |
|---|---|---|---|---|---|---|
| Revenue (MM) | $29,738 | $37,358 | $39,258 | $35,540 | $44,024 | $52,577 |
| Gross Margins | 33.0% | 32.0% | 32.0% | 33.0% | 34.0% | 33.0% |
| Operating Margins | 14% | 14% | 14% | 14% | 20% | 19% |
| Net Margins | 7.0% | 6.0% | 8.0% | 8.0% | 14.0% | 14.0% |
| Net Income (MM) | $2,159 | $2,368 | $3,253 | $2,751 | $5,963 | $7,131 |
| Net Interest Expense (MM) | -$900 | -$1,204 | -$1,466 | -$1,247 | -$993 | -$1,062 |
| Depreciation & Amort. (MM) | -$1,716 | -$1,927 | -$2,019 | -$2,118 | -$2,050 | -$1,895 |
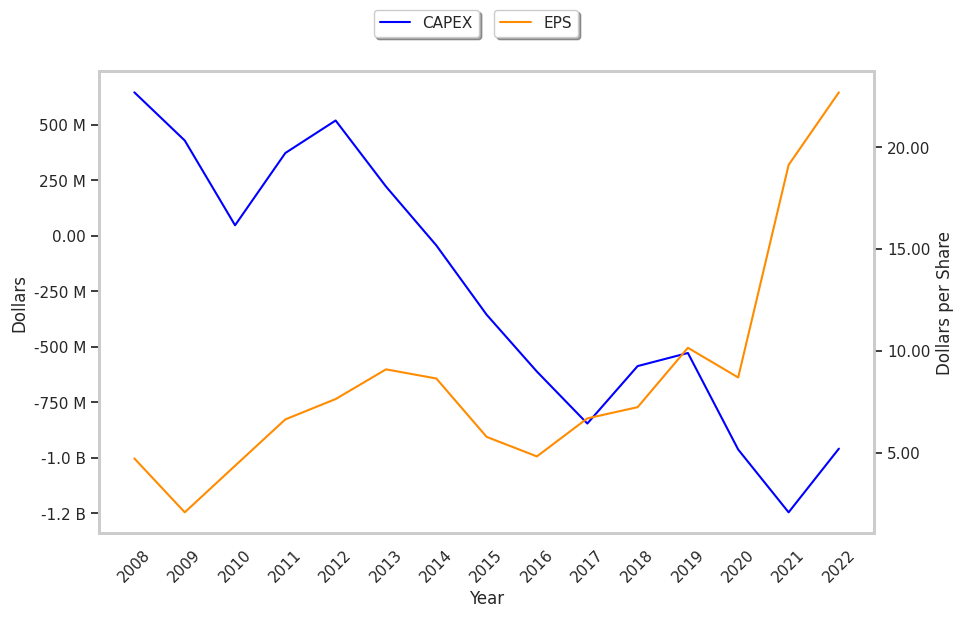
| Earnings Per Share | $6.68 | $7.23 | $10.15 | $8.69 | $19.14 | $22.71 |
| EPS Growth | n/a | 8.23% | 40.39% | -14.38% | 120.25% | 18.65% |
| Diluted Shares (MM) | 323 | 327 | 321 | 317 | 312 | 314 |
| Free Cash Flow (MM) | $1,354 | $1,235 | $2,884 | $6,520 | $6,480 | $3,740 |
| Capital Expenditures (MM) | $846 | $587 | $528 | $963 | $1,246 | $959 |
| Net Current Assets (MM) | -$8,098 | -$10,423 | -$10,826 | -$9,566 | -$5,723 | -$4,198 |
| Long Term Debt (MM) | $25,891 | $27,237 | $30,229 | $32,734 | $32,888 | $33,596 |
| Net Debt / EBITDA | 5.25 | 5.26 | 5.4 | 5.28 | 3.73 | 3.84 |
Deere & Company has weak revenue growth and a flat capital expenditure trend, irregular cash flows, and a decent current ratio. We also note that the company benefits from exceptional EPS growth and average operating margins with a positive growth rate. However, the firm suffers from slimmer gross margins than its peers and a highly leveraged balance sheet.