Today we're going to take a closer look at large-cap Telecommunications company Comcast, whose shares are currently trading at $44.51. We've been asking ourselves whether the company is under or over valued at today's prices... let's perform a brief value analysis to find out!
A Lower P/B Ratio Than Its Sector Average but Trades Above Its Graham Number:
Comcast Corporation operates as a media and technology company worldwide. The company belongs to the Telecommunications sector, which has an average price to earnings (P/E) ratio of 18.85 and an average price to book (P/B) ratio of 3.12. In contrast, Comcast has a trailing 12 month P/E ratio of 28.0 and a P/B ratio of 2.19.
Comcast's PEG ratio is 1.66, which shows that the stock is probably overvalued in terms of its estimated growth. For reference, a PEG ratio near or below 1 is a potential signal that a company is undervalued.
The Company May Be Profitable, but Its Balance Sheet Is Highly Leveraged:
| 2018-01-31 | 2019-01-31 | 2020-01-30 | 2021-02-04 | 2022-02-02 | 2023-02-03 | |
|---|---|---|---|---|---|---|
| Revenue (MM) | $85,029 | $94,507 | $108,942 | $103,564 | $116,385 | $121,427 |
| Gross Margins | 70.0% | 69.0% | 68.0% | 68.0% | 67.0% | 69.0% |
| Operating Margins | 21% | 20% | 19% | 17% | 18% | 19% |
| Net Margins | 27.0% | 12.0% | 12.0% | 10.0% | 12.0% | 4.0% |
| Net Income (MM) | $22,735 | $11,731 | $13,057 | $10,534 | $14,159 | $5,370 |
| Net Interest Expense (MM) | -$3,086 | -$3,542 | -$4,567 | -$4,588 | -$4,281 | -$3,896 |
| Depreciation & Amort. (MM) | -$9,688 | -$10,676 | -$12,953 | -$13,100 | -$13,804 | -$13,821 |
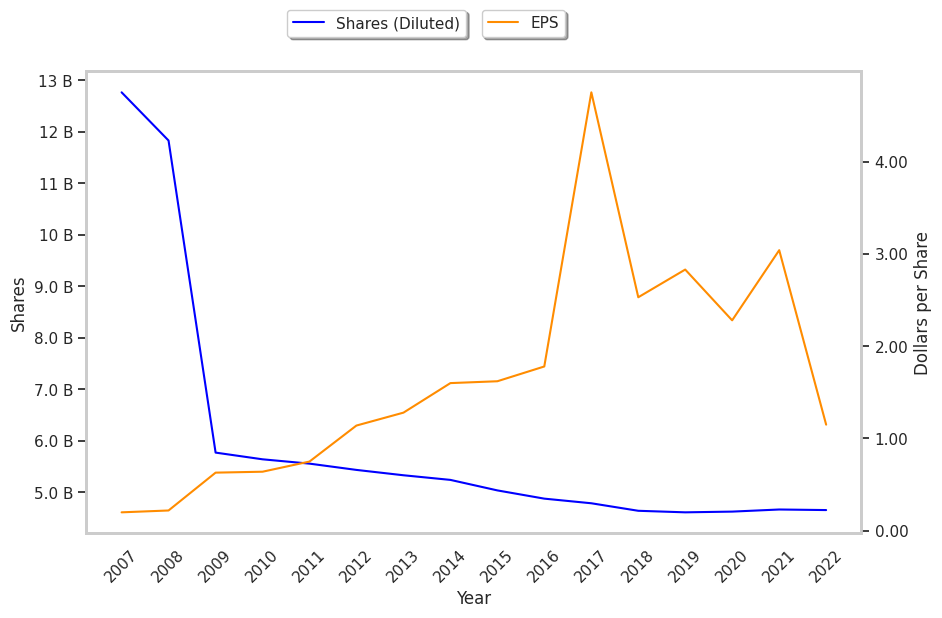
| Earnings Per Share | $4.75 | $2.53 | $2.83 | $2.28 | $3.04 | $1.15 |
| EPS Growth | n/a | -46.74% | 11.86% | -19.43% | 33.33% | -62.17% |
| Diluted Shares (MM) | 4,786 | 4,640 | 4,610 | 4,624 | 4,665 | 4,654 |
| Free Cash Flow (MM) | $32,834 | $36,006 | $38,125 | $36,371 | $41,204 | $40,180 |
| Capital Expenditures (MM) | -$11,573 | -$11,709 | -$12,428 | -$11,634 | -$12,057 | -$13,767 |
| Net Current Assets (MM) | -$100,303 | -$156,018 | -$152,776 | -$154,110 | -$153,090 | -$153,409 |
| Long Term Debt (MM) | $59,422 | $107,345 | $102,931 | $105,782 | $97,888 | $98,240 |
| Net Debt / EBITDA | 2.21 | 3.64 | 2.99 | 3.18 | 2.64 | 2.61 |