Ford Motor Company logged a -0.2% change during today's morning session, and is now trading at a price of $12.05 per share.
Over the last year, Ford Motor Company logged a -1.0% change, with its stock price reaching a high of $15.42 and a low of $10.9. Over the same period, the stock underperformed the S&P 500 index by -14.0%. As of April 2023, the company's 50-day average price was $12.44. Ford Motor Company develops, delivers, and services a range of Ford trucks, commercial cars and vans, sport utility vehicles, and Lincoln luxury vehicles worldwide. Based in Dearborn, MI, the large-cap Consumer Discretionary company has 173,000 full time employees. Ford Motor Company has offered a 5.0% dividend yield over the last 12 months.
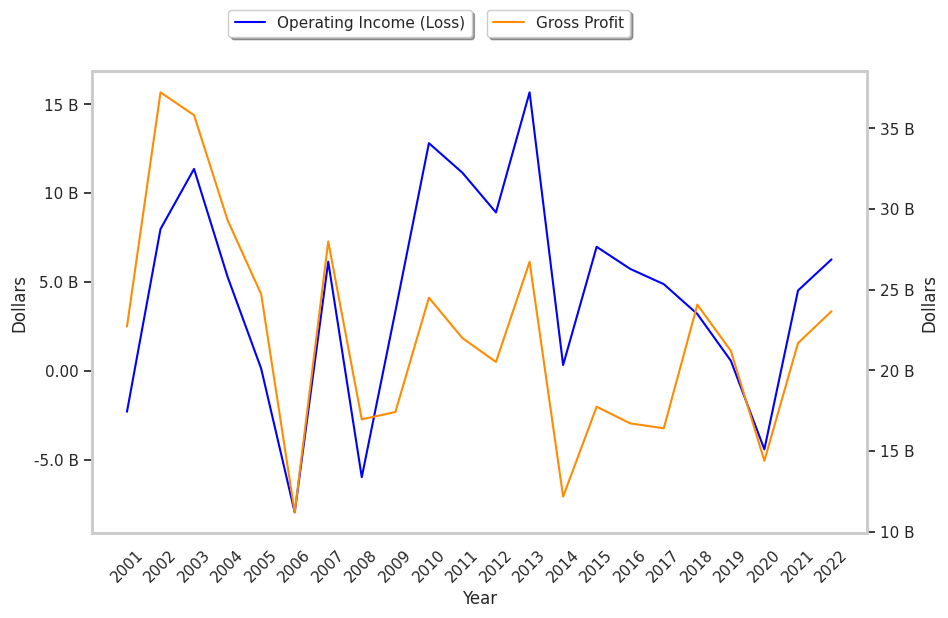
Overview of the Company's Finances:
| 2018-03-28 | 2019-02-21 | 2020-02-05 | 2021-02-05 | 2022-02-04 | 2023-02-03 | |
|---|---|---|---|---|---|---|
| Revenue (MM) | $156,776 | $160,338 | $155,900 | $127,144 | $136,341 | $158,057 |
| Gross Margins | 10.0% | 15.0% | 14.0% | 11.0% | 16.0% | 15.0% |
| Operating Margins | 3% | 2% | 0% | -3% | 3% | 4% |
| Net Margins | 5.0% | 2.0% | 0.0% | -1.0% | 13.0% | -1.0% |
| Net Income (MM) | $7,731 | $3,677 | $47 | -$1,279 | $17,937 | -$1,981 |
| Net Interest Expense (MM) | -$1,190 | -$1,228 | -$1,020 | -$1,649 | -$1,803 | -$1,259 |
| Depreciation & Amort. (MM) | -$8,453 | -$8,413 | -$8,490 | -$7,457 | -$5,960 | -$6,493 |
| Earnings Per Share | $1.93 | $0.92 | $0.01 | -$0.32 | $4.44 | -$0.49 |
| EPS Growth | n/a | -52.33% | -98.91% | -3300.0% | 1487.5% | -111.04% |
| Diluted Shares (MM) | 4,001 | 3,998 | 4,004 | 3,973 | 4,036 | 4,014 |
| Net Current Assets (MM) | -$105,991 | -$105,825 | -$111,260 | -$119,706 | -$99,417 | -$96,241 |
| Long Term Debt (MM) | $102,666 | $100,720 | $101,361 | $110,341 | $88,400 | $88,805 |
| Net Debt / EBITDA | 8.65 | 10.35 | 13.31 | 36.64 | 8.44 | 7.43 |
Ford Motor Company's financial statements include several red flags such as slimmer gross margins than its peers, weak operating margins with a stable trend, and declining EPS growth. Additionally, the firm has a highly leveraged balance sheet. Ford Motor Company has weak revenue growth and no capital expenditures and just enough current assets to cover current liabilities.
Ford Motor Company's Earnings and Assets May Be Undervalued:
Ford Motor Company has a trailing twelve month P/E ratio of 12.1, compared to an average of 22.33 for the Consumer Discretionary sector. Based on its EPS guidance of $1.89, the company has a forward P/E ratio of 6.6. The company doesn't issue forward earnings guidance, and the compound average growth rate of its last 6 years of reported EPS is -9.9%. On this basis, the company's PEG ratio is -1.22, which indicates that its shares are overpriced. In contrast, the market is likely undervaluing Ford Motor Company in terms of its equity because its P/B ratio is 1.1 while the sector average is 3.12.
Ford Motor Company Has an Average Rating of Hold:
The 19 analysts following Ford Motor Company have set target prices ranging from $11.0 to $23.0 per share, for an average of $14.59 with a hold rating. As of April 2023, the company is trading -14.7% away from its average target price, indicating that there is an analyst consensus of some upside potential.
Ford Motor Company has an average amount of shares sold short because 4.0% of the company's shares are sold short. Institutions own 56.2% of the company's shares, and the insider ownership rate stands at 0.19%, suggesting a small amount of insider investors. The largest shareholder is Vanguard Group Inc, whose 9% stake in the company is worth $4,085,993,704.