General Mills (GIS) stock climbed 1.3 % this afternoon. According to our metrics, the company seems overvalued at today's prices. In the below analysis, we will put General Mills's valuation in the context of its strong growth indicators and mixed market sentiment, which are also strong drivers for share price.
General Mills, Inc. manufactures and markets branded consumer foods worldwide. The large-cap Consumer Staples company is based in Minneapolis, United States and has 34,000 full time employees.
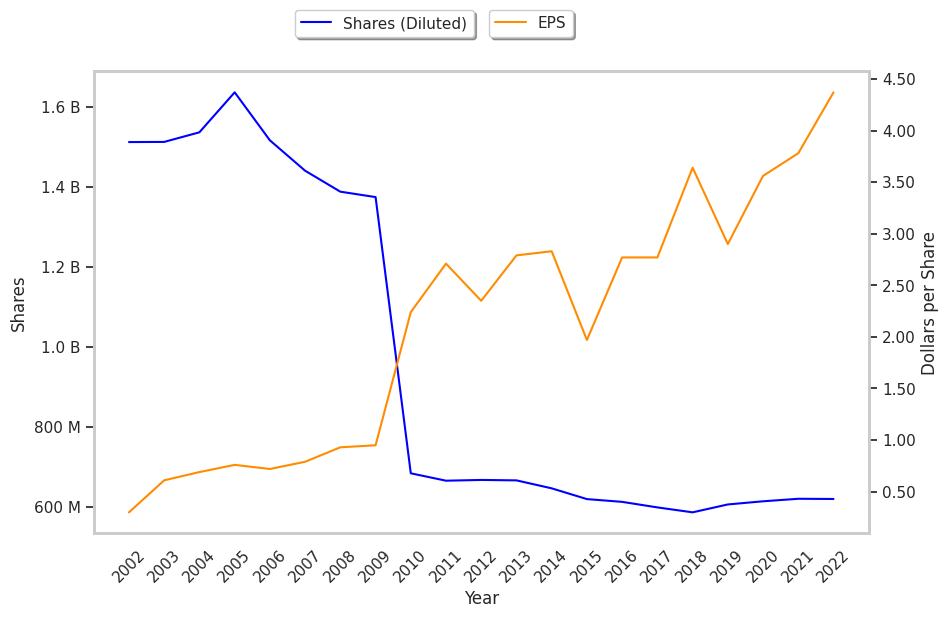
GIS's P/E Ratio Is Better Than the Sector Average
Compared to the Consumer Staples sector's average of 24.36, General Mills has a trailing twelve month price to earnings (P/E) ratio of 15.4 and an expected P/E ratio of 13.4. P/E ratios are calculated by dividing the company's share price by its trailing 12 month or forward earnings per share, which stand at $4.1 and $4.71 respectively.
Earnings represent the net profits left over after subtracting costs of goods sold, taxes, and operating costs from the company's recorded sales revenue. One way of looking at the P/E ratio is that it represents how much investors are willing to pay for every dollar's worth of the company's earnings. Since General Mills's P/E ratio is lower than its sector average, we can deduce that the market is undervaluing the company's earnings.
General Mills Is Fairly Valued in Terms of Expected Growth
Another factor pointing to General Mills's value is its PEG ratio of 1.81. This is the stock's price to earnings ratio divided by its estimated earnings growth rate. If the resulting ratio is near or lower than 1 -- but higher than 0 -- its indicates that the company is faitly valued in terms of expected growth.
GIS Has an Average P/B Ratio
Traditionally, stock pickers used to focus primarily on finding issues that were trading significantly below their tangible asset value, to guarantee themselves a margin of safety. But such an approach would screen out many valuable securities because many profitable businesses -- especially those that heavily leverage information technology -- simply do not have many tangible assets compared to more capital intensive companies.
Therefore, modern value investors tend to focus less on absolute price to book value (P/B) ratios. Instead of singling out stocks with a P/B ratio of less than 1, they will compare the target company against its peer group. For General Mills, the P/B value is 3.58 while the average for the Consumer Staples sector is 4.29.
GIS's Weak Cash Flow Generation Is Troubling
The table below shows that General Mills is not generating enough cash. A well run company will generally have cash flows that reflect the strength of its underlying business, and in General Mills's case, free cash flow is growing at an average rate of 0.0% with a coefficient of variability of 8199107259.1%. We can also see that cash flows from operations are evolving at a 0.0% rate, versus 0.0%:
| Date Reported | Cash Flow from Operations ($ k) | Capital expenditures ($ k) | Free Cash Flow ($ k) | YoY Growth (%) |
|---|---|---|---|---|
| 2022-06-29 | 3,316,100 | -565,400 | 3,881,500 | 10.54 |
| 2021-06-30 | 2,983,200 | -528,100 | 3,511,300 | -15.09 |
| 2020-07-02 | 3,676,200 | -459,100 | 4,135,300 | 24.17 |
| 2019-06-28 | 2,807,000 | -523,300 | 3,330,300 | -3.81 |
| 2018-06-29 | 2,841,000 | -621,300 | 3,462,300 | 11.85 |
| 2017-06-29 | 2,415,200 | -680,200 | 3,095,400 |
General Mills's Margins Are Strong
If you buy a stock for the long run, you want the underlying business model to be profitable. Gross margins tell you how much profit the company generates compared to the cost of revenue, which is the cost directly related to providing General Mills's goods and services. Operating margins, on the other hand, tell you how much of these profits the company keeps after you take overhead into account.
General Mills's Gross Margins
| Date Reported | Revenue ($ k) | Cost of Revenue ($ k) | Gross Margins (%) | YoY Growth (%) |
|---|---|---|---|---|
| 2022-06-29 | 18,992,800 | -12,590,600 | 34 | -5.56 |
| 2021-06-30 | 18,127,000 | -11,678,700 | 36 | 2.86 |
| 2020-07-02 | 17,626,600 | -11,496,700 | 35 | 2.94 |
| 2019-06-28 | 16,865,200 | -11,108,400 | 34 | 0.0 |
| 2018-06-29 | 15,740,400 | -10,312,900 | 34 | -5.56 |
| 2017-06-29 | 15,619,800 | -10,056,000 | 36 |
General Mills's Operating Margins
| Date Reported | Total Revenue ($ k) | Operating Expenses ($ k) | Operating Margins (%) | YoY Growth (%) |
|---|---|---|---|---|
| 2022-06-29 | 18,992,800 | -3,147,000 | 17 | -10.53 |
| 2021-06-30 | 18,127,000 | -3,079,600 | 19 | 11.76 |
| 2020-07-02 | 17,626,600 | -3,151,600 | 17 | 0.0 |
| 2019-06-28 | 16,865,200 | -2,935,800 | 17 | 0.0 |
| 2018-06-29 | 15,740,400 | -2,752,600 | 17 | -5.56 |
| 2017-06-29 | 15,619,800 | -2,801,300 | 18 |
General Mills's cost of revenue is growing at a rate of -0.0% in contrast to 2.0% for operating expenses. Sales revenues, on the other hand, have experienced a 0.0% growth rate. As a result, the average gross margins growth is -0.1 and the average operating margins growth rate is -0.8, with coefficients of variability of 2.8% and 4.8% respectively.
We See Mixed Market Signals Regarding GIS
General Mills has an average rating of hold and target prices ranging from $77.0 to $58.0. At its current price of $63.3, the company is trading -10.03% away from its target price of $70.35. 2.3% of the company's shares are linked to short positions, and 79.1% of the shares are owned by institutional investors.
| Date Reported | Holder | Percentage | Shares | Value |
|---|---|---|---|---|
| 2023-06-30 | Blackrock Inc. | 9% | 54,713,936 | $3,463,118,478 |
| 2023-06-30 | Vanguard Group Inc | 9% | 52,051,176 | $3,294,579,089 |
| 2023-06-30 | State Street Corporation | 6% | 33,076,744 | $2,093,592,450 |
| 2023-06-30 | Capital International Investors | 6% | 32,890,698 | $2,081,816,669 |
| 2023-06-30 | Capital Research Global Investors | 3% | 17,932,702 | $1,135,050,340 |
| 2023-06-30 | Geode Capital Management, LLC | 2% | 11,594,011 | $733,842,905 |
| 2023-06-30 | Morgan Stanley | 1% | 8,218,874 | $520,213,614 |
| 2023-06-30 | Bank of America Corporation | 1% | 8,158,824 | $516,412,750 |
| 2023-06-30 | Northern Trust Corporation | 1% | 7,615,416 | $482,017,741 |
| 2023-06-30 | Price (T.Rowe) Associates Inc | 1% | 7,627,295 | $482,769,623 |