Today we're going to take a closer look at large-cap Technology company International Business Machines, whose shares are currently trading at $142.0. We've been asking ourselves whether the company is under or over valued at today's prices... let's perform a brief value analysis to find out!
International Business Machines's Valuation Is in Line With Its Sector Averages:
International Business Machines Corporation, together with its subsidiaries, provides integrated solutions and services worldwide. The company belongs to the Technology sector, which has an average price to earnings (P/E) ratio of 27.16 and an average price to book (P/B) ratio of 6.23. In contrast, International Business Machines has a trailing 12 month P/E ratio of 60.4 and a P/B ratio of 5.83.
International Business Machines's PEG ratio is 4.37, which shows that the stock is probably overvalued in terms of its estimated growth. For reference, a PEG ratio near or below 1 is a potential signal that a company is undervalued.
The Company Has a Highly Leveraged Balance Sheet and a Declining EPS Growth Trend:
| 2018-02-27 | 2019-02-26 | 2020-02-25 | 2021-02-23 | 2022-02-22 | 2023-02-28 | |
|---|---|---|---|---|---|---|
| Revenue (MM) | $79,139 | $79,591 | $57,714 | $55,179 | $57,350 | $60,530 |
| Gross Margins | 47.0% | 46.0% | 55.0% | 56.0% | 55.0% | 54.0% |
| Operating Margins | 15% | 15% | 12% | 7% | 11% | 12% |
| Net Margins | 7.0% | 11.0% | 16.0% | 10.0% | 10.0% | 3.0% |
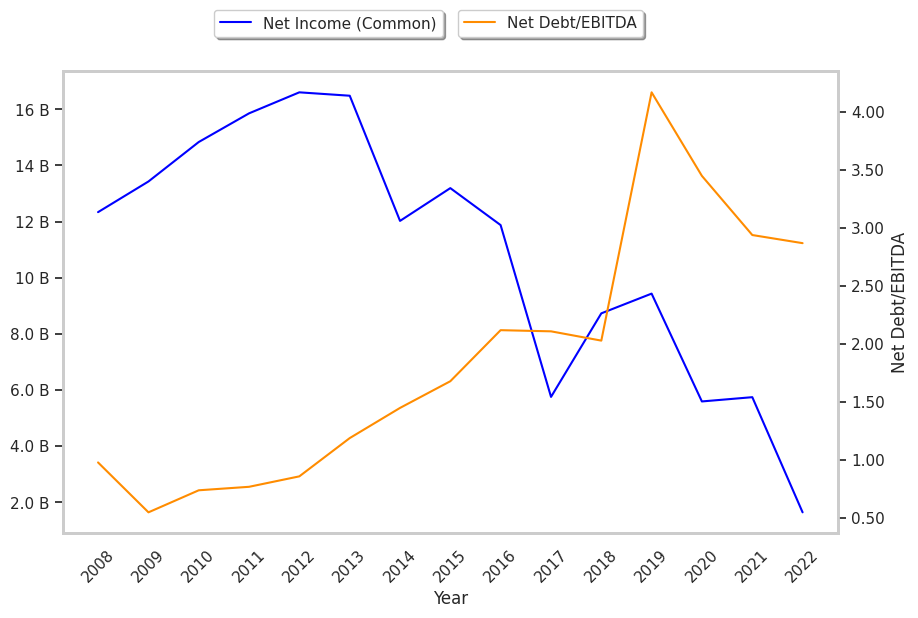
| Net Income (MM) | $5,752 | $8,729 | $9,432 | $5,590 | $5,742 | $1,639 |
| Net Interest Expense (MM) | -$615 | -$723 | -$1,344 | -$1,288 | -$1,155 | -$1,216 |
| Depreciation & Amort. (MM) | -$4,541 | -$4,480 | -$6,059 | -$6,695 | -$6,417 | -$4,802 |
| Earnings Per Share | $5.87 | $9.11 | $10.1 | $5.96 | $6.44 | $1.81 |
| EPS Growth | n/a | 55.2% | 10.87% | -40.99% | 8.05% | -71.89% |
| Diluted Shares (MM) | 981 | 958 | 934 | 938 | 891 | 905 |
| Free Cash Flow (MM) | $19,493 | $18,395 | $16,520 | $20,628 | $14,471 | $11,670 |
| Capital Expenditures (MM) | -$2,769 | -$3,147 | -$1,749 | -$2,430 | -$1,675 | -$1,235 |
| Net Current Assets (MM) | -$57,896 | -$57,309 | -$92,781 | -$96,081 | -$83,467 | -$76,103 |
| Long Term Debt (MM) | $39,837 | $35,605 | $54,102 | $54,217 | $44,917 | $46,189 |
| Net Debt / EBITDA | 2.11 | 2.03 | 4.17 | 3.45 | 2.94 | 2.87 |
International Business Machines has weak revenue growth and a flat capital expenditure trend, weak operating margings with a stable trend, and irregular cash flows. We also note that the company has wider gross margins than its peer group working in its favor. However, the firm suffers from declining EPS growth and a highly leveraged balance sheet.