Now trading at a price of $53.56, Coca-Cola has moved -0.9% so far today.
Over the last year, Coca-Cola logged a -1.0% change, with its stock price reaching a high of $64.99 and a low of $51.55. Over the same period, the stock underperformed the S&P 500 index by -24.0%. As of April 2023, the company's 50-day average price was $58.64. The Coca-Cola Company, a beverage company, manufactures, markets, and sells various nonalcoholic beverages worldwide. Based in Atlanta, GA, the large-cap Consumer Staples company has 82,500 full time employees. Coca-Cola has offered a 3.3% dividend yield over the last 12 months.
Wider Gross Margins Than the Industry Average of 53.55%:
| 2018-02-23 | 2019-02-21 | 2020-02-24 | 2021-02-25 | 2022-02-22 | 2023-02-21 | |
|---|---|---|---|---|---|---|
| Revenue (MM) | $35,410 | $34,300 | $37,266 | $33,014 | $38,655 | $43,004 |
| Gross Margins | 63.0% | 62.0% | 61.0% | 59.0% | 60.0% | 57.0% |
| Operating Margins | 21% | 27% | 27% | 27% | 27% | 25% |
| Net Margins | 4.0% | 19.0% | 24.0% | 23.0% | 25.0% | 22.0% |
| Net Income (MM) | $1,248 | $6,434 | $8,920 | $7,747 | $9,771 | $9,542 |
| Net Interest Expense (MM) | -$164 | -$261 | -$383 | -$1,067 | -$1,321 | -$433 |
| Depreciation & Amort. (MM) | -$1,260 | -$1,086 | -$1,365 | -$1,536 | -$1,452 | -$1,260 |
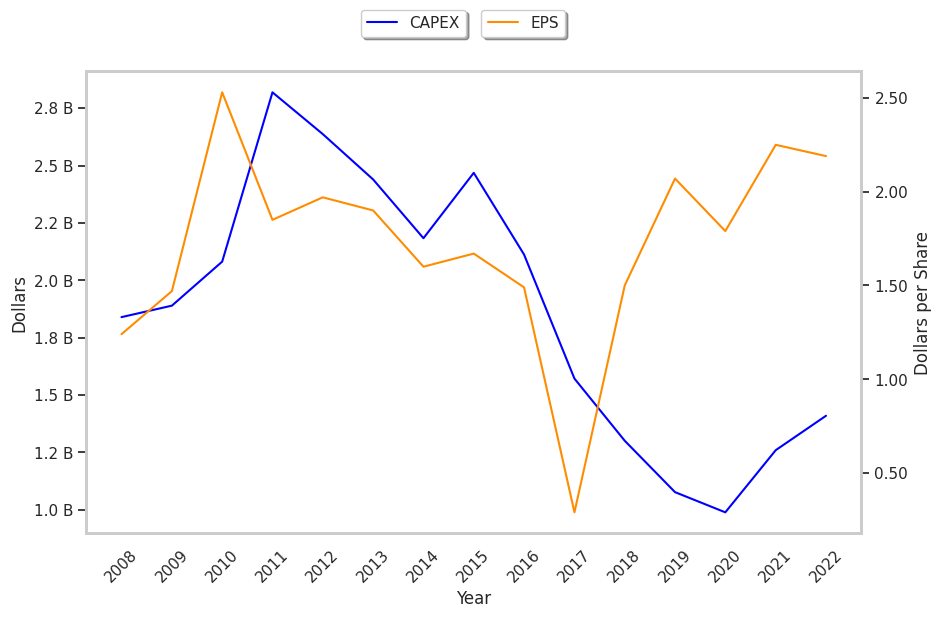
| Earnings Per Share | $0.29 | $1.5 | $2.07 | $1.79 | $2.25 | $2.19 |
| EPS Growth | n/a | 417.24% | 38.0% | -13.53% | 25.7% | -2.67% |
| Diluted Shares (MM) | 4,324 | 4,299 | 4,314 | 4,323 | 4,344 | 4,350 |
| Free Cash Flow (MM) | $8,501 | $8,927 | $11,547 | $10,832 | $13,884 | $12,427 |
| Capital Expenditures (MM) | -$1,571 | -$1,300 | -$1,076 | -$988 | -$1,259 | -$1,409 |
| Net Current Assets (MM) | -$32,374 | -$33,524 | -$44,872 | -$46,772 | -$46,949 | -$44,346 |
| Long Term Debt (MM) | $31,182 | $25,364 | $27,516 | $40,125 | $38,116 | $36,377 |
| Net Debt / EBITDA | 3.65 | 3.18 | 3.04 | 3.25 | 2.56 | 2.26 |
Coca-Cola has strong margins with a stable trend, exceptional EPS growth, and wider gross margins than its peer group. Furthermore, Coca-Cola has weak revenue growth and a flat capital expenditure trend, irregular cash flows, and just enough current assets to cover current liabilities. In addition, we note significant leverage.
Coca-Cola's Valuation Is in Line With Its Sector Averages:
Coca-Cola has a trailing twelve month P/E ratio of 24.3, compared to an average of 24.36 for the Consumer Staples sector. Based on its EPS guidance of $2.8, the company has a forward P/E ratio of 20.9. The company doesn't provide forward earnings guidance, and the compound average growth rate of its last 6 years of reported EPS is 42.3%. On this basis, Coca-Cola's PEG ratio is 0.57. Using instead the 11.1% weighted average of Coca-Cola's earnings CAGR and the broader market's anticipated 5-year EPS growth rate, the company's PEG ratio is 2.18, which suggests that its shares may be overpriced. Furthermore, Coca-Cola is likely overvalued compared to the book value of its equity, since its P/B ratio of 8.9 is higher than the sector average of 4.29. The company's shares are currently trading 213.2% above their Graham number.
Coca-Cola Has an Analyst Consensus of Strong Upside Potential:
The 21 analysts following Coca-Cola have set target prices ranging from $60.0 to $76.0 per share, for an average of $69.14 with a buy rating. As of April 2023, the company is trading -15.2% away from its average target price, indicating that there is an analyst consensus of strong upside potential.
Coca-Cola has a very low short interest because 0.5% of the company's shares are sold short. Institutions own 71.5% of the company's shares, and the insider ownership rate stands at 0.67%, suggesting a small amount of insider investors. The largest shareholder is Berkshire Hathaway, Inc, whose 9% stake in the company is worth $21,423,959,350.