It hasn't been a great afternoon session for Builders FirstSource investors, who have watched their shares sink by -6.0% to a price of $118.09. Some of you might be wondering if it's time to buy the dip. If you are considering this, make sure to check the company's fundamentals first to determine if the shares are fairly valued at today's prices.
A Very Low P/E Ratio but Trades Above Its Graham Number:
Builders FirstSource, Inc., together with its subsidiaries, manufactures and supplies building materials, manufactured components, and construction services to professional homebuilders, sub-contractors, remodelers, and consumers in the United States. The company belongs to the Consumer Discretionary sector, which has an average price to earnings (P/E) ratio of 22.33 and an average price to book (P/B) ratio of 3.12. In contrast, Builders FirstSource has a trailing 12 month P/E ratio of 8.7 and a P/B ratio of 3.4.
When we divide Builders FirstSource's P/E ratio by its expected EPS growth rate of the next five years, we obtain its PEG ratio of -0.95. Since it's negative, the company has negative growth expectations, and most investors will probably avoid the stock unless it has an exceptionally low P/E and P/B ratio.
The Business Has Weak Operating Margins:
| 2018-03-01 | 2019-03-01 | 2020-02-21 | 2021-02-26 | 2022-03-01 | 2023-02-28 | |
|---|---|---|---|---|---|---|
| Revenue (MM) | $7,034 | $7,725 | $7,280 | $8,559 | $19,894 | $22,726 |
| Gross Margins | 25.0% | 25.0% | 27.0% | 26.0% | 28.0% | 34.0% |
| Operating Margins | 4% | 5% | 5% | 6% | 12% | 17% |
| Net Margins | 1.0% | 3.0% | 3.0% | 4.0% | 9.0% | 12.0% |
| Net Income (MM) | $39 | $205 | $222 | $314 | $1,725 | $2,749 |
| Net Interest Expense (MM) | -$193 | -$108 | -$110 | -$136 | -$136 | -$198 |
| Depreciation & Amort. (MM) | -$93 | -$98 | -$100 | -$117 | -$547 | -$497 |
| Earnings Per Share | $0.34 | $1.76 | $1.9 | $2.66 | $8.39 | $16.82 |
| EPS Growth | n/a | 417.65% | 7.95% | 40.0% | 215.41% | 100.48% |
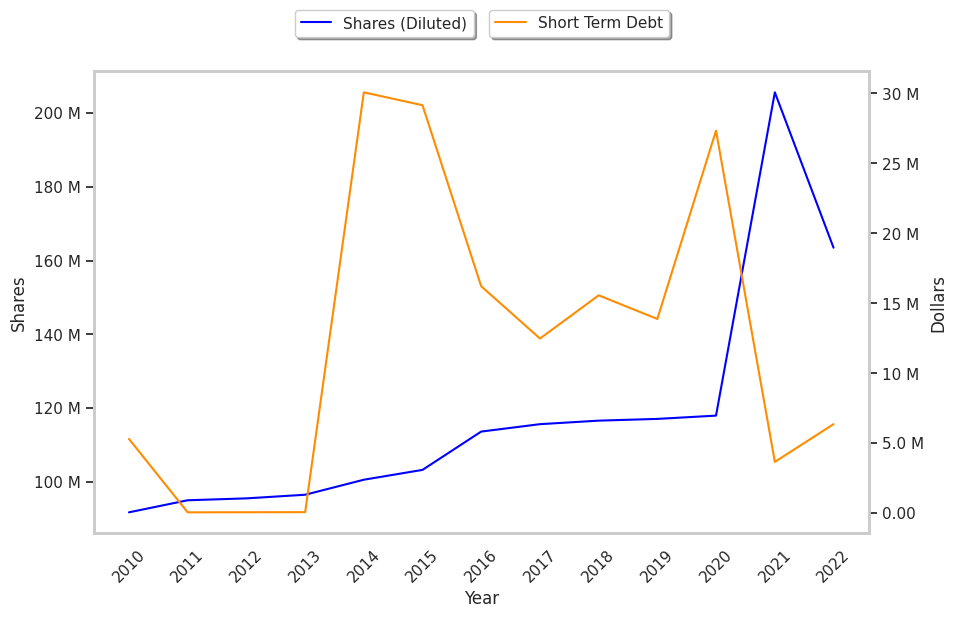
| Diluted Shares (MM) | 116 | 117 | 117 | 118 | 206 | 163 |
| Free Cash Flow (MM) | $238 | $379 | $610 | $364 | $1,958 | $3,929 |
| Capital Expenditures (MM) | -$59 | -$97 | -$106 | -$104 | -$214 | -$329 |
| Net Current Assets (MM) | -$1,234 | -$962 | -$1,118 | -$797 | -$1,944 | -$2,135 |
| Long Term Debt (MM) | $1,772 | $1,546 | $1,277 | $1,597 | $2,926 | $2,978 |
| Net Debt / EBITDA | 4.57 | 3.32 | 2.59 | 1.82 | 0.98 | 0.68 |
Builders FirstSource has weak revenue growth and a flat capital expenditure trend, irregular cash flows, and a decent current ratio. We also note that the company benefits from exceptional EPS growth and healthy leverage. However, the firm suffers from slimmer gross margins than its peers and weak operating margins with a positive growth rate.