Now trading at a price of $293.04, Rockwell Automation has moved 1.6% so far today.
Rockwell Automation returned gains of 28.0% last year, with its stock price reaching a high of $348.52 and a low of $221.83. Over the same period, the stock outperformed the S&P 500 index by 8.0%. More recently, the company's 50-day average price was $294.84. Rockwell Automation, Inc. provides industrial automation and digital transformation solutions in North America, Europe, the Middle East, Africa, the Asia Pacific, and Latin America. Based in Milwaukee, WI, the large-cap Industrials company has 26,000 full time employees. Rockwell Automation has offered a 1.6% dividend yield over the last 12 months.
Wider Gross Margins Than the Industry Average of 34.2%:
| 2017-11-15 | 2018-11-09 | 2019-11-12 | 2020-11-10 | 2021-11-09 | 2022-11-08 | |
|---|---|---|---|---|---|---|
| Revenue (MM) | $6,311 | $6,666 | $6,695 | $6,330 | $6,997 | $7,760 |
| Gross Margins | 42.0% | 43.0% | 43.0% | 41.0% | 41.0% | 40.0% |
| Operating Margins | 18% | 20% | 20% | 17% | 17% | 17% |
| Net Margins | 13.0% | 8.0% | 10.0% | 16.0% | 19.0% | 12.0% |
| Net Income (MM) | $826 | $536 | $696 | $1,023 | $1,358 | $932 |
| Net Interest Expense (MM) | -$76 | -$73 | -$98 | -$104 | -$95 | -$123 |
| Depreciation & Amort. (MM) | -$169 | -$165 | -$152 | -$173 | -$190 | -$239 |
| Earnings Per Share | $6.36 | $4.22 | $5.83 | $8.78 | $11.6 | $7.99 |
| EPS Growth | n/a | -33.65% | 38.15% | 50.6% | 32.12% | -31.12% |
| Diluted Shares (MM) | 130 | 127 | 119 | 117 | 117 | 117 |
| Free Cash Flow (MM) | $1,175 | $1,425 | $1,310 | $1,220 | $1,381 | $964 |
| Capital Expenditures (MM) | -$141 | -$125 | -$128 | -$99 | -$120 | -$140 |
| Net Current Assets (MM) | -$77 | -$1,814 | -$2,723 | -$3,232 | -$4,944 | -$4,131 |
| Long Term Debt (MM) | $1,243 | $1,225 | $1,956 | $1,975 | $3,465 | $2,868 |
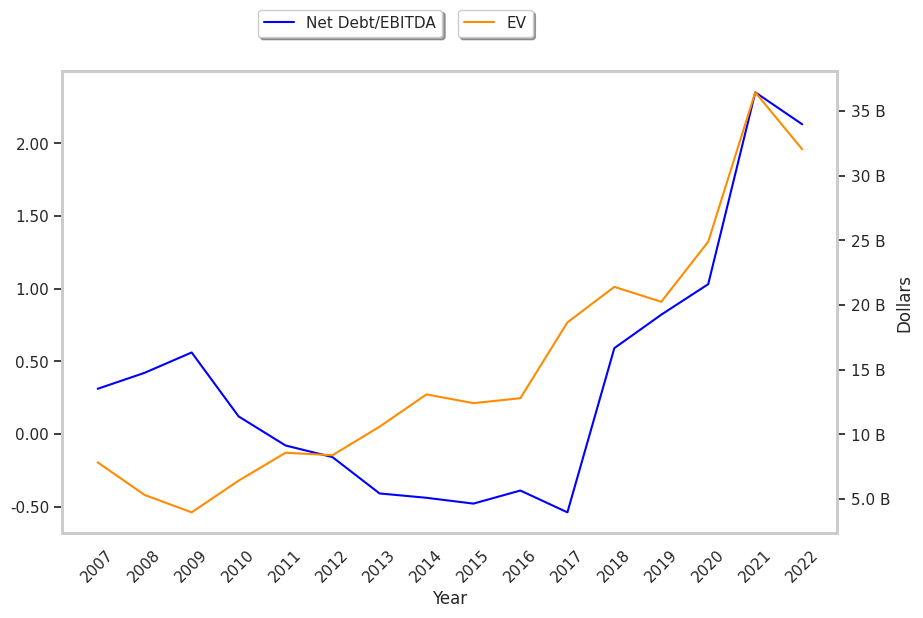
| Net Debt / EBITDA | -0.54 | 0.59 | 0.82 | 1.03 | 2.35 | 2.13 |
Rockwell Automation has strong margins with a stable trend, wider gross margins than its peer group, and positive EPS growth. Furthermore, Rockwell Automation has weak revenue growth and a flat capital expenditure trend, irregular cash flows, and significant leverage.
Rockwell Automation's Valuation Is in Line With Its Sector Averages:
Rockwell Automation has a trailing twelve month P/E ratio of 24.1, compared to an average of 20.49 for the Industrials sector. Based on its EPS guidance of $13.29, the company has a forward P/E ratio of 22.2. The company doesn't issue forward earnings guidance, and the compound average growth rate of its last 6 years of reported EPS is 3.9%. On this basis, the company's PEG ratio is 6.21, which suggests that it is overpriced. Furthermore, Rockwell Automation is likely overvalued compared to the book value of its equity, since its P/B ratio of 10.07 is higher than the sector average of 3.78. The company's shares are currently trading 329.9% above their Graham number.
Analysts Give Rockwell Automation an Average Rating of Hold:
The 19 analysts following Rockwell Automation have set target prices ranging from $220.0 to $375.0 per share, for an average of $314.05 with a hold rating. As of April 2023, the company is trading -6.1% away from its average target price, indicating that there is an analyst consensus of some upside potential.
Rockwell Automation has an average amount of shares sold short because 2.8% of the company's shares are sold short. Institutions own 82.8% of the company's shares, and the insider ownership rate stands at 0.15%, suggesting a small amount of insider investors. The largest shareholder is Vanguard Group Inc, whose 12% stake in the company is worth $3,998,500,719.