We've been asking ourselves recently if the market has placed a fair valuation on Exxon Mobil. Let's dive into some of the fundamental values of this large-cap Energy company to determine if there might be an opportunity here for value-minded investors.
Exxon Mobil's Valuation Is in Line With Its Sector Averages:
Exxon Mobil Corporation engages in the exploration and production of crude oil and natural gas in the United States and internationally. The company belongs to the Energy sector, which has an average price to earnings (P/E) ratio of 7.54 and an average price to book (P/B) ratio of 1.68. In contrast, Exxon Mobil has a trailing 12 month P/E ratio of 9.0 and a P/B ratio of 2.26.
When we divideExxon Mobil's P/E ratio by its expected five-year EPS growth rate, we obtain a PEG ratio of 0.29, which indicates that the market is undervaluing the company's projected growth (a PEG ratio of 1 indicates a fairly valued company). Your analysis of the stock shouldn't end here. Rather, a good PEG ratio should alert you that it may be worthwhile to take a closer look at the stock.
The Business Has Weak Operating Margins:
| 2018-02-28 | 2019-02-27 | 2020-02-26 | 2021-02-24 | 2022-02-23 | 2023-02-22 | |
|---|---|---|---|---|---|---|
| Revenue (MM) | $238,983 | $279,332 | $259,497 | $179,770 | $278,983 | $402,217 |
| Gross Margins | 33.0% | 31.0% | 30.0% | 31.0% | 31.0% | 32.0% |
| Operating Margins | 18% | 19% | 18% | -2% | 20% | 24% |
| Net Margins | 8.0% | 7.0% | 6.0% | -12.0% | 8.0% | 14.0% |
| Net Income (MM) | $19,710 | $20,840 | $14,340 | -$22,440 | $23,040 | $55,740 |
| Net Interest Expense (MM) | -$601 | -$766 | -$830 | -$1,158 | -$947 | -$798 |
| Depreciation & Amort. (MM) | -$19,893 | -$18,745 | -$18,998 | -$46,009 | -$20,607 | -$24,040 |
| Earnings Per Share | $4.63 | $4.88 | $3.36 | -$5.25 | $5.39 | $13.04 |
| EPS Growth | n/a | 5.4% | -31.15% | -256.25% | 202.67% | 141.93% |
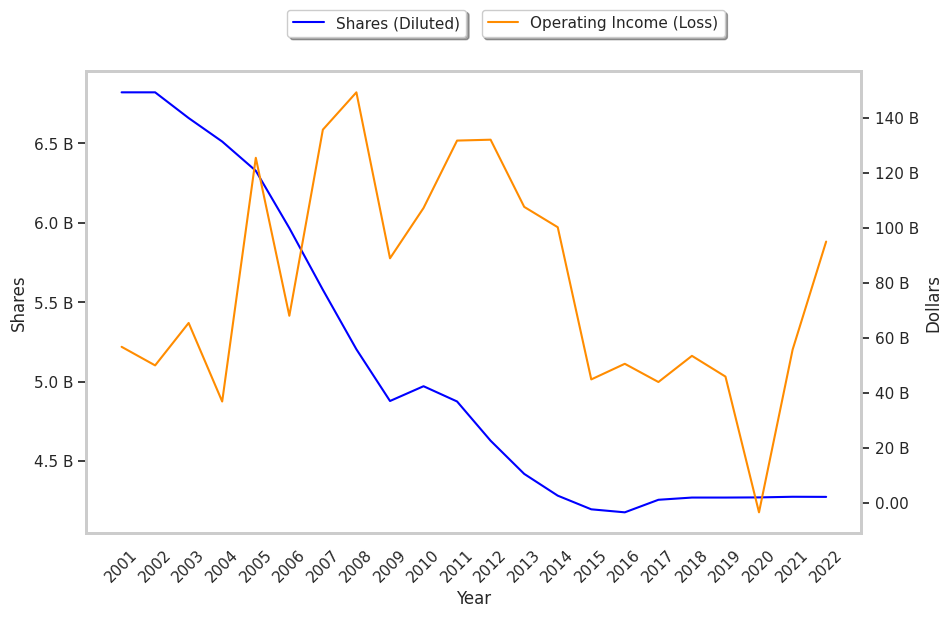
| Diluted Shares (MM) | 4,256 | 4,270 | 4,270 | 4,271 | 4,275 | 4,274 |
| Free Cash Flow (MM) | $45,468 | $55,588 | $54,077 | $31,950 | $60,205 | $95,204 |
| Capital Expenditures (MM) | -$15,402 | -$19,574 | -$24,361 | -$17,282 | -$12,076 | -$18,407 |
| Net Current Assets (MM) | -$107,057 | -$99,695 | -$113,607 | -$123,727 | -$104,086 | -$68,963 |
| Long Term Debt (MM) | $24,406 | $20,538 | $26,342 | $47,182 | $43,428 | $40,559 |
| Net Debt / EBITDA | 0.61 | 0.48 | 0.67 | 1.48 | 0.54 | 0.1 |
Exxon Mobil has weak revenue growth and a flat capital expenditure trend, irregular cash flows, and just enough current assets to cover current liabilities. We also note that the company benefits from low leverage and a strong EPS growth trend. However, the firm suffers from slimmer gross margins than its peers and weak operating margins with a stable trend.