Now trading at a price of $29.85, General Motors Company has moved 0.6% so far today.
General Motors Company returned losses of -16.0% last year, with its stock price reaching a high of $43.63 and a low of $29.06. Over the same period, the stock underperformed the S&P 500 index by -29.0%. As of April 2023, the company's 50-day average price was $32.39. General Motors Company designs, builds, and sells trucks, crossovers, cars, and automobile parts; and provide software-enabled services and subscriptions worldwide. Based in Detroit, MI, the large-cap Consumer Discretionary company has 167,000 full time employees. General Motors Company has offered a 1.2% dividend yield over the last 12 months.
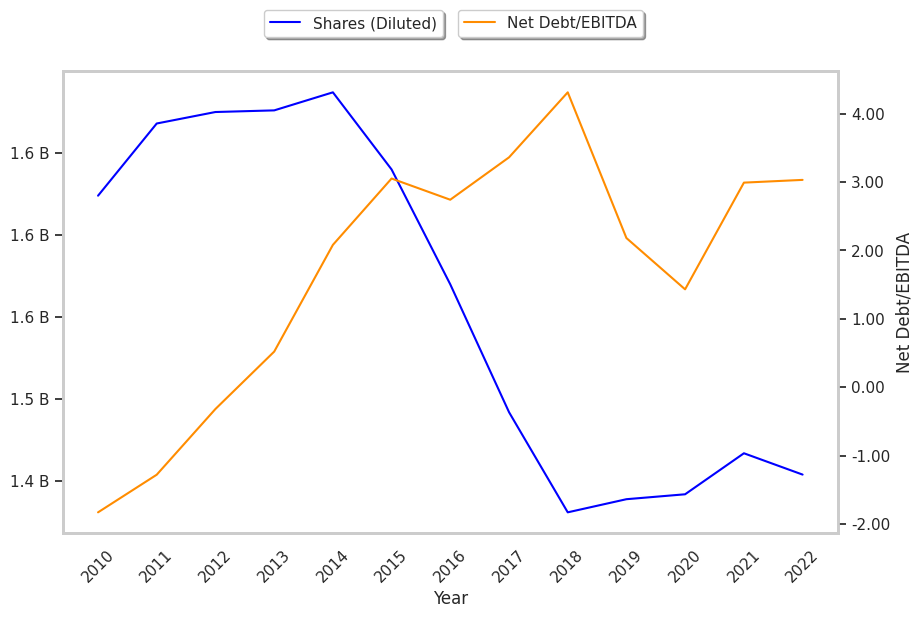
Exceptional EPS Growth at the Expense of a Highly Leveraged Balance Sheet:
| 2018-02-06 | 2019-02-06 | 2020-02-05 | 2021-02-10 | 2022-02-02 | 2023-01-31 | |
|---|---|---|---|---|---|---|
| Revenue (MM) | $145,588 | $147,049 | $137,237 | $122,485 | $127,004 | $156,735 |
| Gross Margins | 13.0% | 10.0% | 10.0% | 20.0% | 21.0% | 19.0% |
| Operating Margins | 6% | 3% | 4% | 5% | 7% | 7% |
| Net Margins | -3.0% | 5.0% | 5.0% | 5.0% | 8.0% | 6.0% |
| Net Income (MM) | -$3,864 | $8,014 | $6,732 | $6,427 | $10,019 | $9,934 |
| Net Interest Expense (MM) | -$575 | -$655 | -$782 | -$1,098 | -$950 | -$987 |
| Depreciation & Amort. (MM) | -$12,261 | -$13,669 | -$14,118 | -$12,815 | -$12,051 | -$11,290 |
| Earnings Per Share | -$2.6 | $5.53 | $4.57 | $4.46 | $6.83 | $6.83 |
| EPS Growth | n/a | 312.69% | -17.36% | -2.41% | 53.14% | 0.0% |
| Diluted Shares (MM) | 1,492 | 1,431 | 1,439 | 1,442 | 1,467 | 1,454 |
| Free Cash Flow (MM) | $38,294 | $29,889 | $25,715 | $23,804 | $22,906 | $22,995 |
| Capital Expenditures (MM) | -$20,966 | -$14,633 | -$10,694 | -$7,134 | -$7,718 | -$6,953 |
| Net Current Assets (MM) | -$107,538 | -$109,269 | -$107,088 | -$104,593 | -$96,800 | -$91,303 |
| Long Term Debt (MM) | $67,254 | $73,060 | $65,924 | $56,788 | $59,304 | $60,036 |
| Net Debt / EBITDA | 3.36 | 4.31 | 2.18 | 1.43 | 2.99 | 3.03 |
General Motors Company has weak revenue growth and a flat capital expenditure trend, average net margins with a stable trend, and irregular cash flows. In addition, we note just enough current assets to cover current liabilities. We also note that the company has exceptional EPS growth working in its favor. However, the firm suffers from slimmer gross margins than its peers and a highly leveraged balance sheet.
General Motors Company Has Attractive Multiples and Trades Below Its Graham Number:
General Motors Company has a trailing twelve month P/E ratio of 4.5, compared to an average of 22.33 for the Consumer Discretionary sector. Based on its EPS guidance of $6.94, the company has a forward P/E ratio of 4.7. The company doesn't provide forward earnings guidance, and the compound average growth rate of its last 6 years of reported EPS is 24.0%. On this basis, General Motors Company's PEG ratio is 0.19. Using instead the 10.5% weighted average of General Motors Company's earnings CAGR and the broader market's anticipated 5-year EPS growth rate, the company's PEG ratio is 0.43, which implies that its shares may be underpriced. Additionally, the market is possibly undervaluing General Motors Company in terms of its equity because its P/B ratio is 0.58 whereas the sector average is 3.12. The company's shares are currently trading -65.9% below their Graham number.
General Motors Company Has an Analyst Consensus of Strong Upside Potential:
The 23 analysts following General Motors Company have set target prices ranging from $29.0 to $90.0 per share, for an average of $48.34 with a buy rating. As of April 2023, the company is trading -33.0% away from its average target price, indicating that there is an analyst consensus of strong upside potential.
General Motors Company has an average amount of shares sold short because 2.4% of the company's shares are sold short. Institutions own 83.9% of the company's shares, and the insider ownership rate stands at 0.2%, suggesting a small amount of insider investors. The largest shareholder is Blackrock Inc., whose 10% stake in the company is worth $3,929,723,953.