We've been asking ourselves recently if the market has placed a fair valuation on Oracle. Let's dive into some of the fundamental values of this large-cap Technology company to determine if there might be an opportunity here for value-minded investors.
Oracle's Valuation Is in Line With Its Sector Averages:
Oracle Corporation offers products and services that address enterprise information technology environments worldwide. The company belongs to the Technology sector, which has an average price to earnings (P/E) ratio of 27.16 and an average price to book (P/B) ratio of 6.23. In contrast, Oracle has a trailing 12 month P/E ratio of 30.5 and a P/B ratio of 118.86.
Oracle's PEG ratio is 1.9, which shows that the stock is probably overvalued in terms of its estimated growth. For reference, a PEG ratio near or below 1 is a potential signal that a company is undervalued.
EPS Trend Sustained Primarily by Reducing the Number of Shares Outstanding:
| 2017-06-27 | 2018-06-22 | 2019-06-21 | 2020-06-22 | 2021-06-21 | 2022-06-21 | |
|---|---|---|---|---|---|---|
| Revenue (MM) | $37,792 | $39,383 | $39,506 | $39,068 | $40,479 | $42,440 |
| Gross Margins | 80.0% | 80.0% | 80.0% | 80.0% | 81.0% | 79.0% |
| Operating Margins | 36% | 35% | 35% | 36% | 39% | 37% |
| Net Margins | 25.0% | 9.0% | 28.0% | 26.0% | 34.0% | 16.0% |
| Net Income (MM) | $9,452 | $3,587 | $11,083 | $10,135 | $13,746 | $6,717 |
| Net Interest Expense (MM) | -$1,798 | -$2,025 | -$2,082 | -$1,995 | -$2,496 | -$2,755 |
| Depreciation & Amort. (MM) | -$2,451 | -$2,785 | -$2,919 | -$2,968 | -$2,916 | -$3,122 |
| Earnings Per Share | $2.24 | $0.85 | $2.97 | $3.08 | $4.55 | $2.41 |
| EPS Growth | n/a | -62.05% | 249.41% | 3.7% | 47.73% | -47.03% |
| Diluted Shares (MM) | 4,217 | 4,238 | 3,732 | 3,294 | 3,022 | 2,786 |
| Free Cash Flow (MM) | $16,147 | $17,122 | $16,211 | $14,703 | $18,022 | $14,050 |
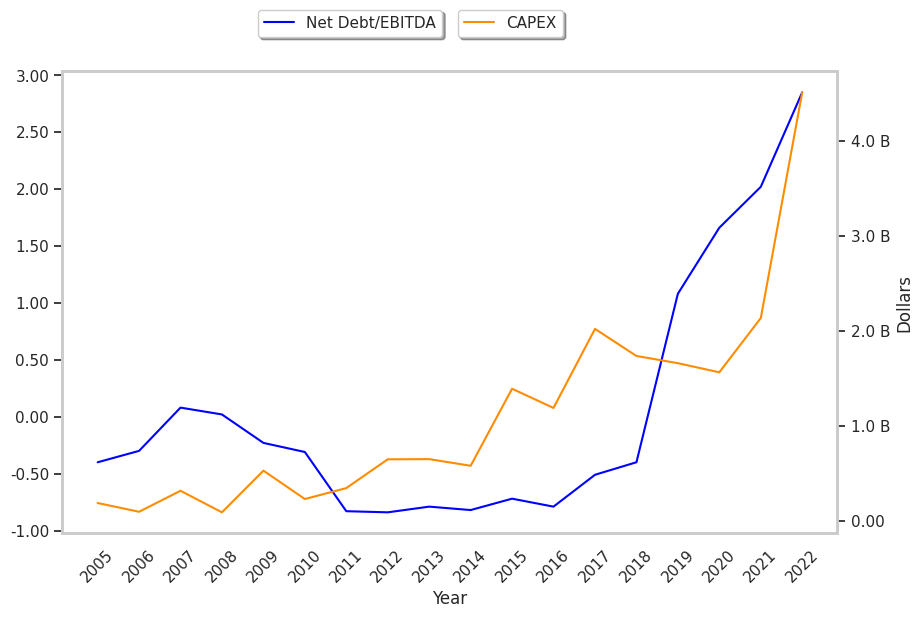
| Capital Expenditures (MM) | -$2,021 | -$1,736 | -$1,660 | -$1,564 | -$2,135 | -$4,511 |
| Net Current Assets (MM) | -$6,230 | -$14,819 | -$39,960 | -$50,581 | -$69,588 | -$83,432 |
| Long Term Debt (MM) | $48,112 | $56,128 | $51,673 | $69,226 | $75,995 | $72,110 |
| Net Debt / EBITDA | -0.51 | -0.4 | 1.08 | 1.66 | 2.02 | 2.85 |
Oracle has weak revenue growth and a flat capital expenditure trend, irregular cash flows, and a decent current ratio. We also note that the company benefits from strong margins with a stable trend and wider gross margins than its peer group. However, the firm suffers from EPS growth achieved by reducing the number of outstanding shares and a highly leveraged balance sheet.