Now trading at a price of $40.47, Comcast has moved 2.1% so far today.
Comcast returned gains of 28.0% last year, with its stock price reaching a high of $47.46 and a low of $30.04. Over the same period, the stock outperformed the S&P 500 index by 20.0%. More recently, the company's 50-day average price was $44.55. Comcast Corporation operates as a media and technology company worldwide. Based in Philadelphia, PA, the large-cap Telecommunications company has 186,000 full time employees. Comcast has offered a 2.9% dividend yield over the last 12 months.
Increasing Revenues but Narrowing Margins:
| 2018 | 2019 | 2020 | 2021 | 2022 | 2023 | |
|---|---|---|---|---|---|---|
| Revenue (MM) | $94,507 | $108,942 | $103,564 | $116,385 | $121,427 | $120,605 |
| Gross Margins | 20% | 19% | 17% | 18% | 12% | 12% |
| Operating Margins | 20.0% | 19.0% | 17.0% | 18.0% | 12.0% | 12.0% |
| Net Margins | 13.0% | 12.0% | 10.0% | 12.0% | 4.0% | 5.0% |
| Net Income (MM) | $11,862 | $13,323 | $10,701 | $14,159 | $5,370 | $6,507 |
| Net Interest Expense (MM) | $3,542 | $4,567 | $4,588 | $4,281 | $3,896 | $3,943 |
| Depreciation & Amort. (MM) | $8,281 | $8,663 | $8,320 | $13,804 | $13,821 | $14,050 |
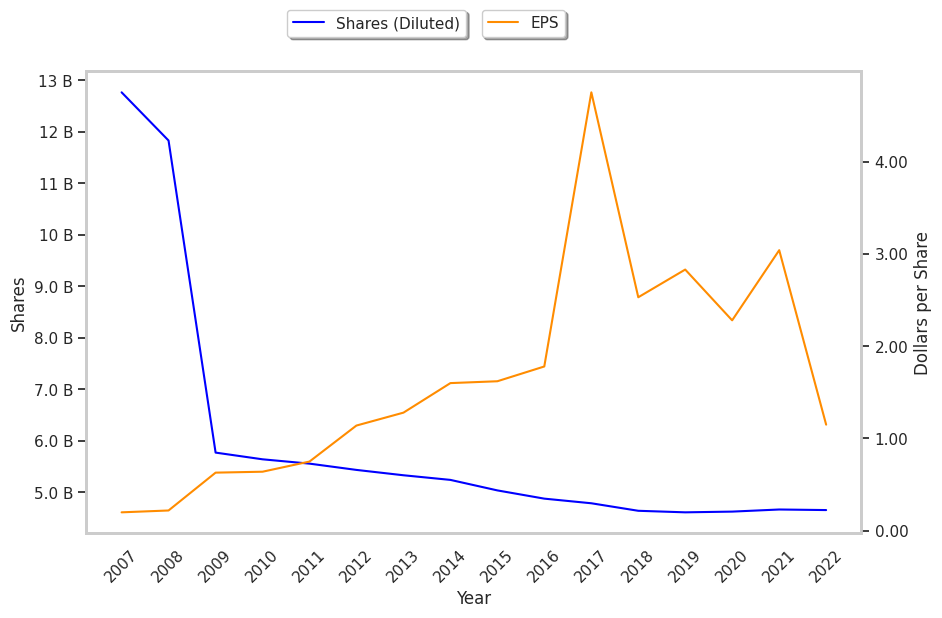
| Earnings Per Share | $2.53 | $2.83 | $2.28 | $3.04 | $1.21 | $1.6 |
| EPS Growth | n/a | 11.86% | -19.43% | 33.33% | -60.2% | 32.23% |
| Diluted Shares (MM) | 4,640 | 4,610 | 4,624 | 4,654 | 4,430 | 3,800 |
| Free Cash Flow (MM) | $14,523 | $15,744 | $15,558 | $19,972 | $15,787 | $15,821 |
| Capital Expenditures (MM) | $9,774 | $9,953 | $9,179 | $9,174 | $10,626 | $11,434 |
| Net Current Assets (MM) | -$21,084 | -$21,665 | -$20,277 | -$25,161 | -$26,456 | -$28,283 |
| Long Term Debt (MM) | $107,345 | $97,765 | $100,614 | $92,718 | $93,068 | $94,972 |
| Net Debt / EBITDA | 3.95 | 3.25 | 3.63 | 2.54 | 3.3 | 3.41 |
Comcast has slimmer gross margins than its peers, declining EPS growth, and a highly leveraged balance sheet. On the other hand, the company has growing revenues and a flat capital expenditure trend working in its favor. Furthermore, Comcast has average net margins with a negative growth trend and irregular cash flows.
A Lower P/B Ratio Than Its Sector Average but Trades Above Its Graham Number:
Comcast has a trailing twelve month P/E ratio of 12.4, compared to an average of 18.85 for the Telecommunications sector. Based on its EPS guidance of $4.2, the company has a forward P/E ratio of 10.6. The company doesn't issue forward earnings guidance, and the compound average growth rate of its last 6 years of reported EPS is -7.4%. On this basis, the company's PEG ratio is -1.69, which indicates that its shares are overpriced. In contrast, the market is likely undervaluing Comcast in terms of its equity because its P/B ratio is 1.99 while the sector average is 3.12. The company's shares are currently trading 43.3% above their Graham number.
There's an Analyst Consensus of Some Upside Potential for Comcast:
The 26 analysts following Comcast have set target prices ranging from $41.0 to $55.0 per share, for an average of $49.27 with a buy rating. As of April 2023, the company is trading -9.6% away from its average target price, indicating that there is an analyst consensus of some upside potential.
Comcast has a very low short interest because 1.5% of the company's shares are sold short. Institutions own 87.9% of the company's shares, and the insider ownership rate stands at 0.74%, suggesting a small amount of insider investors. The largest shareholder is Vanguard Group Inc, whose 10% stake in the company is worth $15,795,923,529.