Today we're going to take a closer look at large-cap Industrials company Baker Hughes Company, whose shares are currently trading at $34.05. We've been asking ourselves whether the company is under or over valued at today's prices... let's perform a brief value analysis to find out!
Baker Hughes Company's Valuation Is in Line With Its Sector Averages:
Baker Hughes Company provides a portfolio of technologies and services to energy and industrial value chain worldwide. The company belongs to the Industrials sector, which has an average price to earnings (P/E) ratio of 20.49 and an average price to book (P/B) ratio of 3.78. In contrast, Baker Hughes Company has a trailing 12 month P/E ratio of 20.4 and a P/B ratio of 2.25.
When we divideBaker Hughes Company's P/E ratio by its expected five-year EPS growth rate, we obtain a PEG ratio of 0.53, which indicates that the market is undervaluing the company's projected growth (a PEG ratio of 1 indicates a fairly valued company). Your analysis of the stock shouldn't end here. Rather, a good PEG ratio should alert you that it may be worthwhile to take a closer look at the stock.
Shareholders Are Confronted With Declining EPS Growth:
| 2018 | 2019 | 2020 | 2021 | 2022 | 2023 | |
|---|---|---|---|---|---|---|
| Revenue (MM) | $22,877 | $23,838 | $20,705 | $20,502 | $21,156 | $23,305 |
| Gross Margins | 3% | 5% | -77% | 6% | 6% | 14% |
| Operating Margins | 3.0% | 5.0% | -73.0% | 6.0% | 6.0% | 8.0% |
| Net Margins | 1.0% | 1.0% | -28.0% | -1.0% | 0.0% | 5.0% |
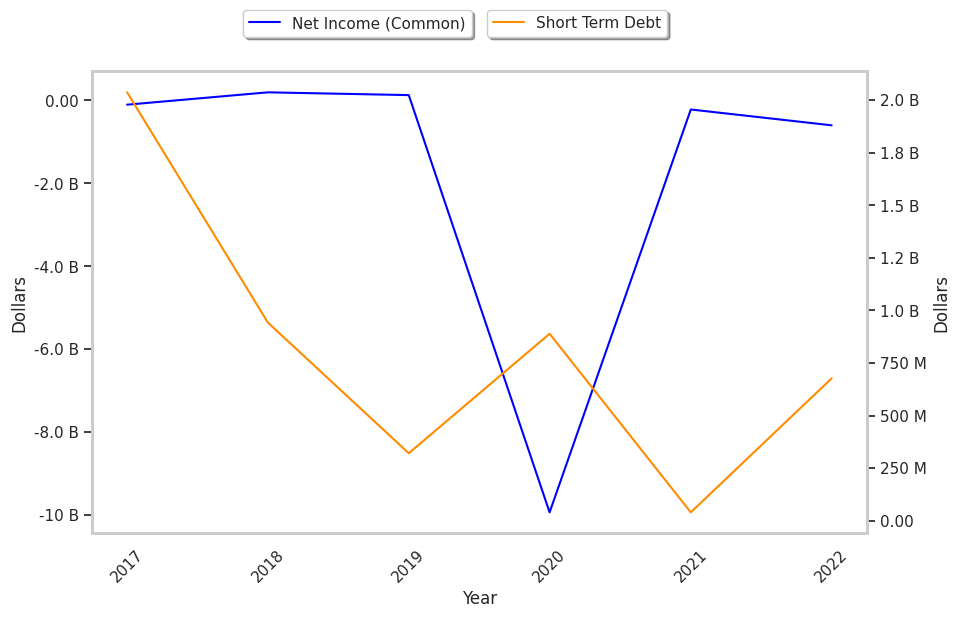
| Net Income (MM) | $283 | $271 | -$5,821 | -$111 | $23 | $1,174 |
| Net Interest Expense (MM) | $202 | -$84 | $1,040 | -$299 | -$252 | $231 |
| Depreciation & Amort. (MM) | $1,486 | $1,418 | $1,317 | $1,105 | $1,061 | $1,054 |
| Free Cash Flow (MM) | $767 | $886 | $330 | $1,518 | $899 | $1,733 |
| Capital Expenditures (MM) | $995 | $1,240 | $974 | $856 | $989 | $1,082 |
| Net Current Assets (MM) | $3,955 | $2,675 | $3,591 | $3,303 | $1,111 | $1,071 |
| Long Term Debt (MM) | $6,285 | $6,301 | $6,744 | $6,687 | $5,980 | $5,847 |
| Net Debt / EBITDA | 1.19 | 1.35 | -0.2 | 1.19 | 1.68 | 1.31 |
Baker Hughes Company has weak revenue growth and a flat capital expenditure trend, similar gross margins to its peers, and irregular cash flows. We also note that the company has healthy leverage working in its favor. However, the firm suffers from consistently negative margins with a positive growth rate and declining EPS growth.