Now trading at a price of $60.41, Occidental Petroleum has moved -0.3% so far today.
Occidental Petroleum returned losses of -18.0% last year, with its stock price reaching a high of $75.78 and a low of $55.51. Over the same period, the stock underperformed the S&P 500 index by -29.0%. As of April 2023, the company's 50-day average price was $63.72. Occidental Petroleum Corporation, together with its subsidiaries, engages in the acquisition, exploration, and development of oil and gas properties in the United States, the Middle East, North Africa, and Latin America. Based in Houston, TX, the large-cap Energy company has 11,973 full time employees. Occidental Petroleum has offered a 1.1% dividend yield over the last 12 months.
Growing Revenues With a Flat Capital Expenditure Trend:
| 2018 | 2019 | 2020 | 2021 | 2022 | 2023 | |
|---|---|---|---|---|---|---|
| Revenue (MM) | $15,560 | $20,911 | $17,809 | $25,956 | $36,634 | $31,536 |
| Operating Margins | 34.0% | 2.0% | -88.0% | 14.0% | 39.0% | 28.0% |
| Net Margins | 27.0% | -2.0% | -76.0% | 11.0% | 36.0% | 42.0% |
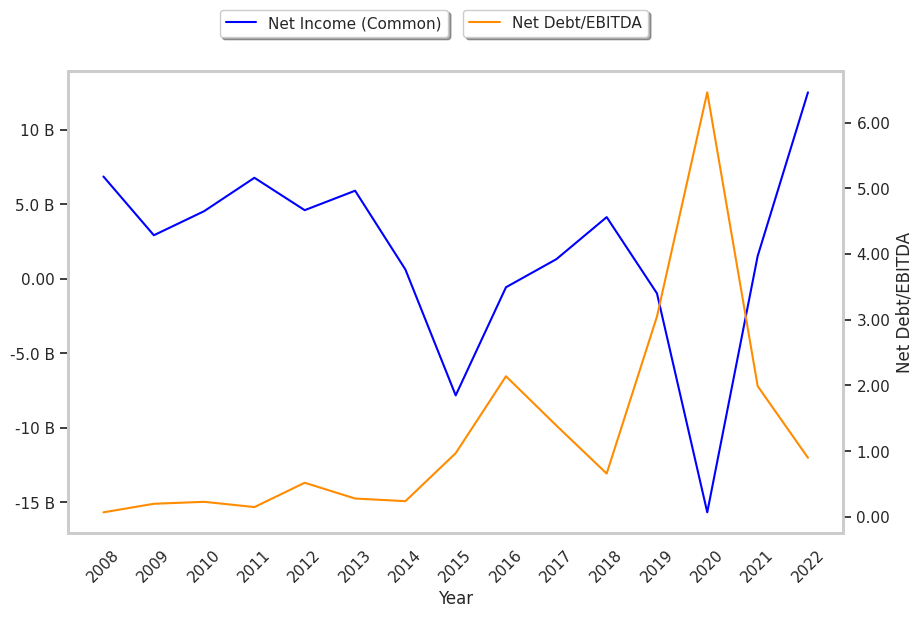
| Net Income (MM) | $4,131 | -$507 | -$13,533 | $2,790 | $13,304 | $13,304 |
| Net Interest Expense (MM) | $389 | $1,066 | $1,424 | $1,614 | $1,110 | $1,013 |
| Depreciation & Amort. (MM) | $3,977 | $6,140 | $8,097 | $8,447 | $6,926 | $6,985 |
| Earnings Per Share | $5.39 | -$1.22 | -$17.06 | $1.58 | $12.4 | $5.91 |
| Diluted Shares (MM) | 763 | 810 | 919 | 959 | 1,002 | 920 |
| Free Cash Flow (MM) | $2,694 | $1,008 | $1,420 | $7,564 | $12,313 | $11,036 |
| Capital Expenditures (MM) | $4,975 | $6,367 | $2,535 | $2,870 | $4,497 | $5,774 |
| Net Current Assets (MM) | -$1,387 | -$16,128 | -$14,912 | -$12,717 | -$10,476 | -$4,250 |
| Long Term Debt (MM) | $10,201 | $38,537 | $35,745 | $29,431 | $19,670 | $19,669 |
| Net Debt / EBITDA | 0.79 | 5.48 | -4.53 | 2.22 | 0.9 | 1.21 |
Occidental Petroleum has growing revenues and a flat capital expenditure trend, positive EPS growth, and healthy leverage. However, the firm has weak operating margins with a stable trend. Finally, we note that Occidental Petroleum has irregular cash flows.
Occidental Petroleum's Valuation Is in Line With Its Sector Averages:
Occidental Petroleum has a trailing twelve month P/E ratio of 13.9, compared to an average of 7.54 for the Energy sector. Based on its EPS guidance of $5.02, the company has a forward P/E ratio of 12.7. The company doesn't issue forward earnings guidance, and the compound average growth rate of its last 6 years of reported EPS is 1.5%. On this basis, the company's PEG ratio is 8.98, which suggests that it is overpriced. Furthermore, Occidental Petroleum is likely overvalued compared to the book value of its equity, since its P/B ratio of 2.52 is higher than the sector average of 1.68. The company's shares are currently trading -10.8% below their Graham number. In conclusion, Occidental Petroleum's impressive cash flow trend, decent P/B ratio, and reasonable use of leverage demonstrate that the company may still be fairly valued — despite its elevated earnings multiple.
There's an Analyst Consensus of Some Upside Potential for Occidental Petroleum:
The 24 analysts following Occidental Petroleum have set target prices ranging from $59.0 to $85.0 per share, for an average of $71.25 with a buy rating. As of April 2023, the company is trading -10.6% away from its average target price, indicating that there is an analyst consensus of some upside potential.
Occidental Petroleum has an above average percentage of its shares sold short because 9.3% of the company's shares are sold short. Institutions own 79.6% of the company's shares, and the insider ownership rate stands at 0.28%, suggesting a small amount of insider investors. The largest shareholder is Berkshire Hathaway, Inc, whose 25% stake in the company is worth $13,539,644,454.