It's been a great morning session for Bank of America investors, who saw their shares rise 1.4% to a price of $29.64 per share. At these higher prices, is the company still fairly valued? If you are thinking about investing, make sure to check the company's fundamentals before making a decision.
Bank of America Is Potentially Undervalued and Trades Below Its Graham Number:
Bank of America Corporation, through its subsidiaries, provides banking and financial products and services for individual consumers, small and middle-market businesses, institutional investors, large corporations, and governments worldwide. The company belongs to the Finance sector, which has an average price to earnings (P/E) ratio of 14.34 and an average price to book (P/B) ratio of 1.57. In contrast, Bank of America has a trailing 12 month P/E ratio of 8.3 and a P/B ratio of 0.91.
Bank of America's PEG ratio is 2.03, which shows that the stock is probably overvalued in terms of its estimated growth. For reference, a PEG ratio near or below 1 is a potential signal that a company is undervalued.
EPS Trend Sustained Primarily by Reducing the Number of Shares Outstanding:
| 2018 | 2019 | 2020 | 2021 | 2022 | 2023 | |
|---|---|---|---|---|---|---|
| Revenue (MM) | $91,020 | $91,244 | $85,528 | $89,113 | $94,950 | $105,705 |
| Interest Income (MM) | $48,162 | $48,891 | $43,360 | $42,934 | $52,462 | $57,052 |
| Operating Margins | 38.0% | 36.0% | 22.0% | 38.0% | 33.0% | 32.0% |
| Net Margins | 31.0% | 30.0% | 21.0% | 36.0% | 28.0% | 28.0% |
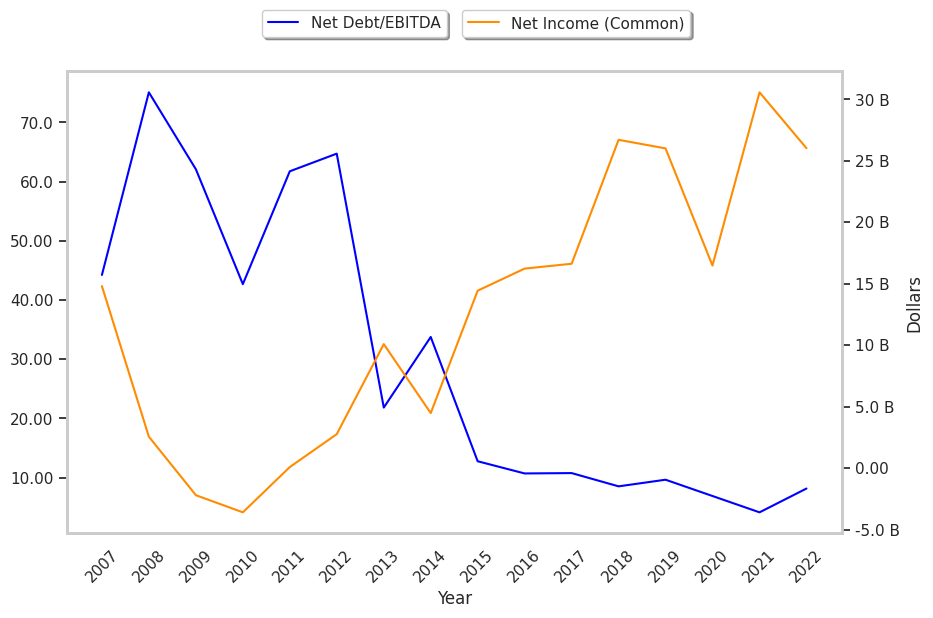
| Net Income (MM) | $28,147 | $27,430 | $17,894 | $31,978 | $27,528 | $29,783 |
| Depreciation & Amort. (MM) | $538 | $1,729 | $1,843 | $1,898 | $1,978 | $2,006 |
| Earnings Per Share | $2.61 | $2.75 | $1.87 | $3.57 | $3.19 | $3.48 |
| Diluted Shares (MM) | 10,237 | 9,443 | 8,797 | 8,558 | 8,168 | 8,065 |
| Free Cash Flow (MM) | $39,520 | $61,777 | $37,993 | -$7,193 | -$6,327 | $44,638 |
| Net Current Assets (MM) | -$2,012,999 | -$2,104,175 | -$2,473,236 | -$2,811,532 | -$2,608,520 | -$2,660,736 |
| Long Term Debt (MM) | $229,392 | $240,856 | $262,934 | $280,117 | $275,982 | $286,073 |
| Net Debt / EBITDA | 2.06 | 3.0 | -4.71 | -1.24 | 2.21 | -1.32 |
Bank of America has weak revenue growth and no capital expenditures, average net margins with a stable trend, and irregular cash flows. We also note that the company has low leverage working in its favor. However, the firm has EPS growth achieved by reducing the number of outstanding shares.