Today we're going to take a closer look at large-cap Telecommunications company Comcast, whose shares are currently trading at $42.58. We've been asking ourselves whether the company is under or over valued at today's prices... let's perform a brief value analysis to find out!
A Lower P/B Ratio Than Its Sector Average but Trades Above Its Graham Number:
Comcast Corporation operates as a media and technology company worldwide. The company belongs to the Telecommunications sector, which has an average price to earnings (P/E) ratio of 18.85 and an average price to book (P/B) ratio of 3.12. In contrast, Comcast has a trailing 12 month P/E ratio of 11.9 and a P/B ratio of 2.09.
P/E rations can be placed into context by dividing them by the firm's expected 5-year EPS growth rate, which gives us its Price to Earnings Growth (PEG) ratio. Comcast's PEG ratio is 1.16, which tells us the company is fairly valued in terms of growth. PEG ratios under 1 are considered an indicator of undervalued growth, but we need to keep in mind that many successful companies with excellent share performance have maintained much higher PEG ratios.
As always, a quantitative approach to a stock should be supplemented with a look at qualitative factors, such as the competence of its management team, quality of its corporate culture, and the wide variety of social and economic factors that can impact the success of its product.
Increasing Revenues but Narrowing Margins:
| 2018 | 2019 | 2020 | 2021 | 2022 | 2023 | |
|---|---|---|---|---|---|---|
| Revenue (MM) | $94,507 | $108,942 | $103,564 | $116,385 | $121,427 | $120,605 |
| Gross Margins | 20% | 19% | 17% | 18% | 12% | 12% |
| Operating Margins | 20.0% | 19.0% | 17.0% | 18.0% | 12.0% | 12.0% |
| Net Margins | 13.0% | 12.0% | 10.0% | 12.0% | 4.0% | 5.0% |
| Net Income (MM) | $11,862 | $13,323 | $10,701 | $14,159 | $5,370 | $6,507 |
| Net Interest Expense (MM) | $3,542 | $4,567 | $4,588 | $4,281 | $3,896 | $3,943 |
| Depreciation & Amort. (MM) | $8,281 | $8,663 | $8,320 | $13,804 | $13,821 | $14,050 |
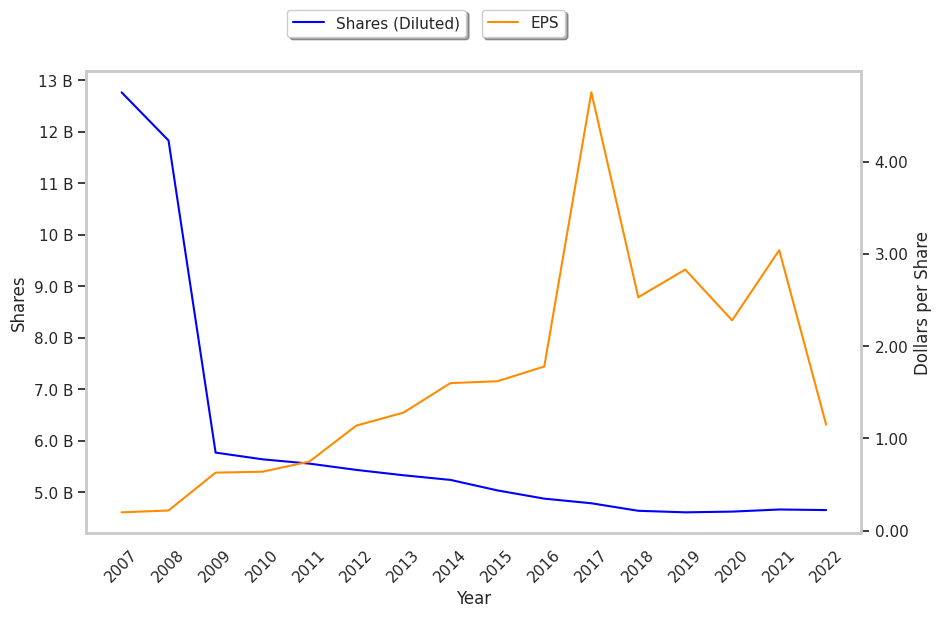
| Earnings Per Share | $2.56 | $2.89 | $2.31 | $3.04 | $1.21 | $1.71 |
| Diluted Shares (MM) | 4,640 | 4,610 | 4,624 | 4,654 | 4,430 | 3,800 |
| Free Cash Flow (MM) | $14,523 | $15,744 | $15,558 | $19,972 | $15,787 | $15,821 |
| Capital Expenditures (MM) | $9,774 | $9,953 | $9,179 | $9,174 | $10,626 | $11,434 |
| Net Current Assets (MM) | -$21,084 | -$21,665 | -$20,277 | -$25,161 | -$26,456 | -$28,283 |
| Long Term Debt (MM) | $107,345 | $97,765 | $100,614 | $92,718 | $93,068 | $94,972 |
| Net Debt / EBITDA | 3.95 | 3.25 | 3.63 | 2.54 | 3.3 | 3.41 |
Comcast has slimmer gross margins than its peers, declining EPS growth, and a highly leveraged balance sheet. On the other hand, the company has growing revenues and a flat capital expenditure trend working in its favor. Furthermore, Comcast has average net margins with a negative growth trend and irregular cash flows.