It hasn't been a great afternoon session for Exelon investors, who have watched their shares sink by -1.3% to a price of $38.56. Some of you might be wondering if it's time to buy the dip. If you are considering this, make sure to check the company's fundamentals first to determine if the shares are fairly valued at today's prices.
Exelon's Valuation Is in Line With Its Sector Averages:
Exelon Corporation, a utility services holding company, engages in the energy distribution and transmission businesses in the United States and Canada. The company belongs to the Utilities sector, which has an average price to earnings (P/E) ratio of 22.89 and an average price to book (P/B) ratio of 1.03. In contrast, Exelon has a trailing 12 month P/E ratio of 17.9 and a P/B ratio of 1.51.
Exelon's PEG ratio is 2.66, which shows that the stock is probably overvalued in terms of its estimated growth. For reference, a PEG ratio near or below 1 is a potential signal that a company is undervalued.
The Company's Revenues Are Declining:
| 2018 | 2019 | 2020 | 2021 | 2022 | 2023 | |
|---|---|---|---|---|---|---|
| Revenue (MM) | $35,978 | $16,725 | $16,663 | $17,938 | $19,078 | $19,893 |
| Gross Margins | 11% | 16% | 13% | 15% | 17% | 18% |
| Operating Margins | 11.0% | 16.0% | 13.0% | 15.0% | 17.0% | 18.0% |
| Net Margins | 6.0% | 18.0% | 12.0% | 10.0% | 11.0% | 11.0% |
| Net Income (MM) | $2,079 | $3,028 | $1,954 | $1,829 | $2,171 | $2,120 |
| Net Interest Expense (MM) | $1,529 | $1,591 | $1,610 | $1,264 | $1,422 | $1,565 |
| Depreciation & Amort. (MM) | $5,971 | $5,780 | $6,527 | $7,573 | $3,533 | $3,406 |
| Free Cash Flow (MM) | $1,050 | -$589 | -$3,813 | -$4,969 | $4,870 | -$3,934 |
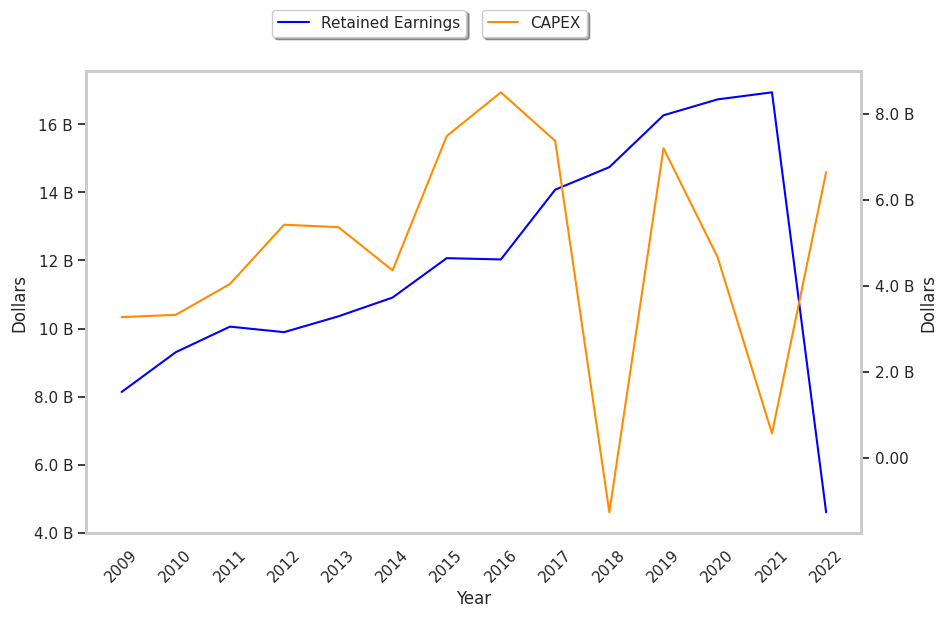
| Capital Expenditures (MM) | $7,594 | $7,248 | $8,048 | $7,981 | n/a | $7,325 |
| Net Current Assets (MM) | -$73,259 | -$78,367 | -$81,887 | -$84,261 | -$63,269 | -$65,459 |
| Long Term Debt (MM) | $34,075 | $10,995 | $14,057 | $30,749 | $35,272 | $39,492 |
| Net Debt / EBITDA | 3.64 | 1.89 | 2.64 | 3.99 | 5.71 | 6.03 |
Exelon's financial statements include several red flags such as declining revenues and a flat capital expenditure trend, slimmer gross margins than its peers, and an unconvincing cash flow history. Additionally, the firm has a highly leveraged balance sheet. On the other hand, the company has positive EPS growth working in its favor. Furthermore, Exelon has average net margins with a positive growth rate.