We've been asking ourselves recently if the market has placed a fair valuation on Lowe's Companies. Let's dive into some of the fundamental values of this large-cap Consumer Discretionary company to determine if there might be an opportunity here for value-minded investors.
Lowe's Companies's Valuation Is in Line With Its Sector Averages:
Lowe's Companies, Inc., together with its subsidiaries, operates as a home improvement retailer in the United States. The company belongs to the Consumer Discretionary sector, which has an average price to earnings (P/E) ratio of 22.33. In contrast, Lowe's Companies has a trailing 12 month P/E ratio of 19.2 based on its earnings per share of $10.34.
There is an important limit on the usefulness of P/E ratios. Since the P/E ratio is the share price divided by earnings per share, the ratio is determined partially by market sentiment on the stock. Sometimes a negative sentiment translates to a lower market price and therefore a lower P/E ratio -- and there might be good reasons for this negative sentiment.
One of the main reasons not to blindly invest in a company with a low P/E ratio is that it might have low growth expectations. Low growth correlates with low stock performance, so it's useful to factor growth into the valuation process. One of the easiest ways to do this is to divide the company's P/E ratio by its expected growth rate, which results in the price to earnings growth, or PEG ratio.
Lowe's Companies's PEG ratio is 2.53, which shows that the stock is overvalued in terms of its estimated growth. For reference, a PEG ratio near or below 1 is a potential signal that a company is undervalued.
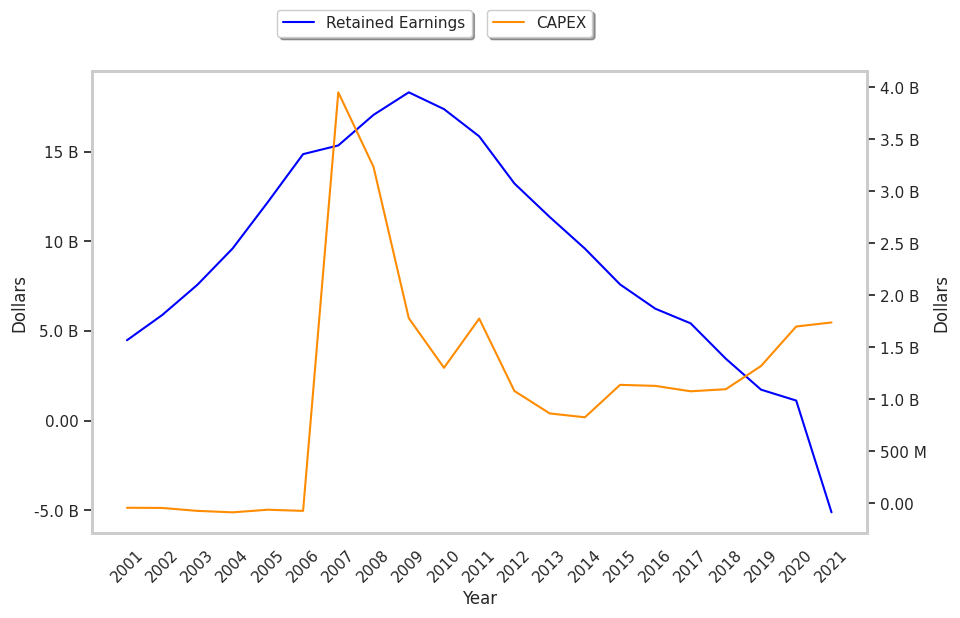
Growing Revenues With Increasing Reinvestment in the Business:
| 2018 | 2019 | 2020 | 2021 | 2022 | 2023 | |
|---|---|---|---|---|---|---|
| Revenue (MM) | $68,619 | $71,309 | $72,148 | $89,597 | $96,250 | $97,059 |
| Gross Margins | 33.0% | 32.0% | 32.0% | 33.0% | 33.0% | 33.0% |
| Operating Margins | 10.0% | 6.0% | 9.0% | 11.0% | 13.0% | 10.0% |
| Net Margins | 5.0% | 3.0% | 6.0% | 7.0% | 9.0% | 7.0% |
| Net Income (MM) | $3,447 | $2,314 | $4,281 | $5,835 | $8,442 | $6,437 |
| Net Interest Expense (MM) | -$633 | -$624 | $30 | $32 | $30 | $29 |
| Depreciation & Amort. (MM) | $1,540 | $1,607 | $1,410 | $1,594 | $1,882 | $1,981 |
| Earnings Per Share | $4.09 | $2.84 | $5.49 | $7.75 | $12.04 | $10.17 |
| Diluted Shares (MM) | 840 | 812 | 778 | 750 | 699 | 631 |
| Free Cash Flow (MM) | $3,942 | $5,019 | $2,812 | $9,258 | $8,260 | $6,760 |
| Capital Expenditures (MM) | $1,123 | $1,174 | $1,484 | $1,791 | $1,853 | $1,829 |
| Net Current Assets (MM) | -$16,181 | -$21,644 | -$19,891 | -$26,127 | -$34,850 | -$37,017 |
| Long Term Debt (MM) | $14,460 | $16,635 | $21,185 | $23,881 | $32,904 | $35,839 |
| Net Debt / EBITDA | 1.71 | 3.03 | 1.76 | 1.8 | 2.18 | 2.72 |