Today we're going to take a closer look at large-cap Consumer Discretionary company Mastercard, whose shares are currently trading at $410.93. We've been asking ourselves whether the company is under or over valued at today's prices... let's perform a brief value analysis to find out!
Mastercard Has Elevated P/B and P/E Ratios:
Mastercard Incorporated, a technology company, provides transaction processing and other payment-related products and services in the United States and internationally. The company belongs to the Consumer Discretionary sector, which has an average price to earnings (P/E) ratio of 22.33 and an average price to book (P/B) ratio of 3.12. In contrast, Mastercard has a trailing 12 month P/E ratio of 35.9 and a P/B ratio of 61.14.
Mastercard's PEG ratio is 1.93, which shows that the stock is probably overvalued in terms of its estimated growth. For reference, a PEG ratio near or below 1 is a potential signal that a company is undervalued.
Growing Revenues With Increasing Reinvestment in the Business:
| 2018 | 2019 | 2020 | 2021 | 2022 | 2023 | |
|---|---|---|---|---|---|---|
| Revenue (MM) | $14,950 | $16,883 | $15,301 | $18,884 | $22,237 | $23,590 |
| Operating Margins | 49.0% | 57.0% | 53.0% | 55.0% | 55.0% | 55.0% |
| Net Margins | 39.0% | 48.0% | 42.0% | 46.0% | 45.0% | 43.0% |
| Net Income (MM) | $5,859 | $8,118 | $6,411 | $8,687 | $9,930 | $10,230 |
| Net Interest Expense (MM) | $186 | $224 | $380 | $431 | $471 | $523 |
| Depreciation & Amort. (MM) | $459 | $522 | $580 | $726 | $750 | $752 |
| Earnings Per Share | $5.6 | $7.94 | $6.37 | $8.76 | $10.22 | $10.67 |
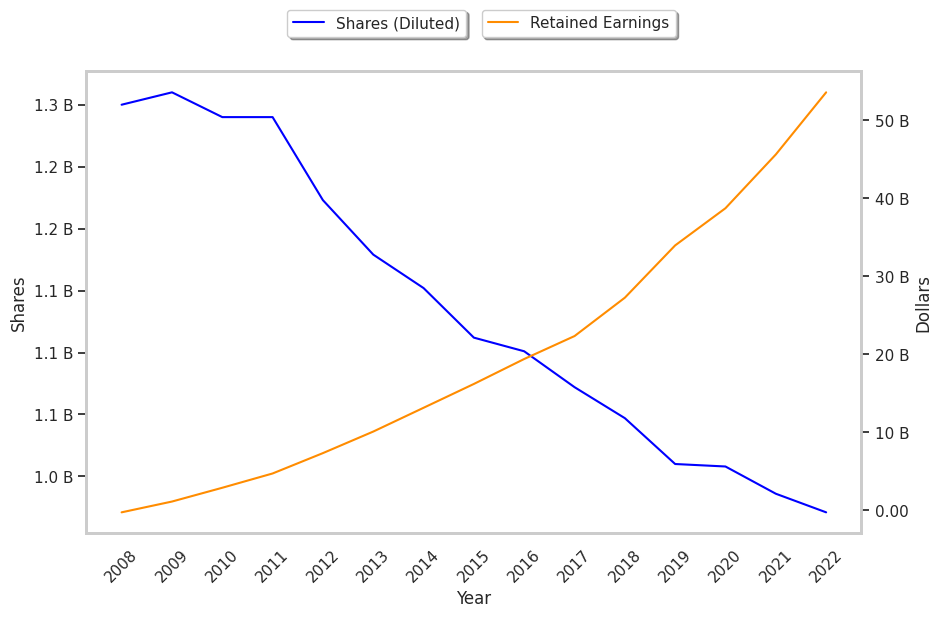
| Diluted Shares (MM) | 1,047 | 1,022 | 1,006 | 992 | 971 | 921 |
| Free Cash Flow (MM) | $5,893 | $7,761 | $6,885 | $9,056 | $10,753 | $11,142 |
| Capital Expenditures (MM) | $330 | $422 | $339 | $407 | $442 | $431 |
| Net Current Assets (MM) | -$3,200 | -$6,343 | -$7,954 | -$13,308 | -$15,741 | -$16,895 |
| Long Term Debt (MM) | $5,834 | $8,527 | $12,023 | $13,109 | $13,749 | $14,284 |
| Net Debt / EBITDA | 0.45 | 0.51 | 0.51 | 0.66 | 0.64 | 0.78 |
Mastercard benefits from growing revenues and increasing reinvestment in the business, strong margins with a stable trend, and a pattern of improving cash flows. The company's financial statements show low leverage and a strong EPS growth trend.