We've been asking ourselves recently if the market has placed a fair valuation on Fidelity National Information Services. Let's dive into some of the fundamental values of this large-cap Consumer Discretionary company to determine if there might be an opportunity here for value-minded investors.
Fidelity National Information Services Has an Attractive P/B Ratio but a Worrisome P/E Ratio:
Fidelity National Information Services, Inc. provides technology solutions for financial institutions and businesses worldwide. The company belongs to the Consumer Discretionary sector, which has an average price to earnings (P/E) ratio of 22.33 and an average price to book (P/B) ratio of 3.12. In contrast, Fidelity National Information Services has a trailing 12 month P/E ratio of -2.0 and a P/B ratio of 1.7.
Fidelity National Information Services's PEG ratio is 8.07, which shows that the stock is probably overvalued in terms of its estimated growth. For reference, a PEG ratio near or below 1 is a potential signal that a company is undervalued.
Increasing Revenues but Narrowing Margins:
| 2018 | 2019 | 2020 | 2021 | 2022 | 2023 | |
|---|---|---|---|---|---|---|
| Revenue (MM) | $8,423 | $10,333 | $12,552 | $13,877 | $14,528 | $14,573 |
| Gross Margins | 34% | 36% | 33% | 37% | 39% | 40% |
| Operating Margins | 17% | 9% | 4% | 8% | -111% | -112% |
| Net Margins | 10% | 3% | 1% | 3% | 0% | 0% |
| Net Income (MM) | $881 | $303 | $164 | $424 | $12 | $11 |
| Net Interest Expense (MM) | $314 | $389 | $339 | $216 | $300 | $300 |
| Depreciation & Amort. (MM) | $1,420 | $24 | $3,714 | $4,015 | $31 | $3,640 |
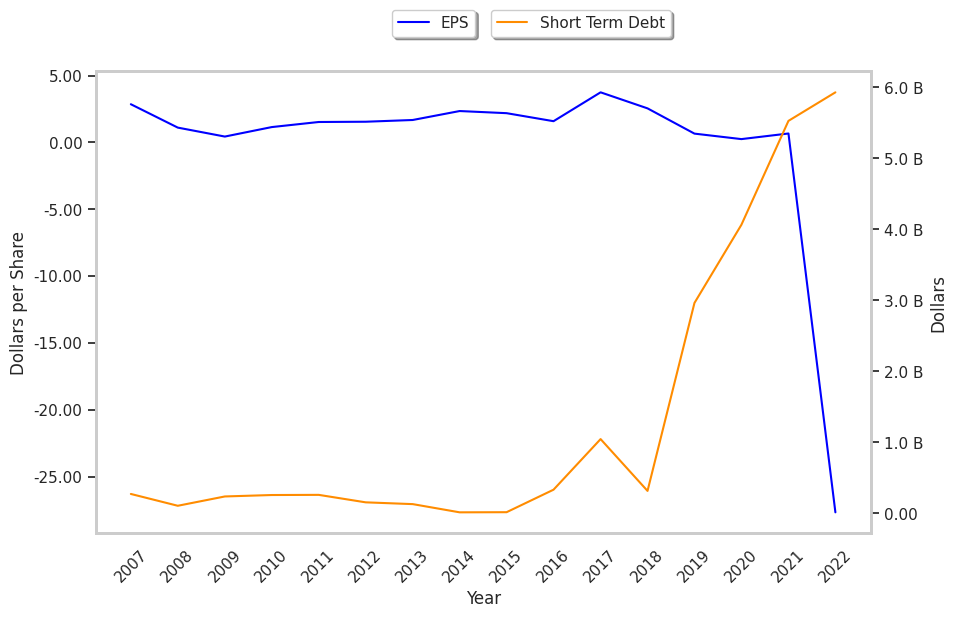
| Earnings Per Share | $2.55 | $0.66 | $0.25 | $0.67 | -$27.68 | -$39.23 |
| Diluted Shares (MM) | 332 | 451 | 627 | 621 | 604 | 564 |
| Free Cash Flow (MM) | $1,866 | $2,210 | $4,179 | $4,490 | $3,671 | $3,564 |
| Capital Expenditures (MM) | $127 | $200 | $263 | $320 | $268 | $174 |
| Net Current Assets (MM) | -$9,815 | -$25,658 | -$24,457 | -$24,691 | -$23,054 | -$22,651 |
| Long Term Debt (MM) | $8,670 | $17,229 | $15,951 | $14,825 | $14,207 | $13,589 |