Today we're going to take a closer look at large-cap Utilities company Cheniere Energy, whose shares are currently trading at $179.41. We've been asking ourselves whether the company is under or over valued at today's prices... let's perform a brief value analysis to find out!
A Very Low P/E Ratio but Trades Above Its Graham Number:
Cheniere Energy, Inc., an energy infrastructure company, primarily engages in the liquefied natural gas (LNG) related businesses in the United States. The company belongs to the Utilities sector, which has an average price to earnings (P/E) ratio of 22.89 and an average price to book (P/B) ratio of 1.03. In contrast, Cheniere Energy has a trailing 12 month P/E ratio of 3.6 and a P/B ratio of 10.34.
When we divideCheniere Energy's P/E ratio by its expected five-year EPS growth rate, we obtain a PEG ratio of 0.22, which indicates that the market is undervaluing the company's projected growth (a PEG ratio of 1 indicates a fairly valued company). Your analysis of the stock shouldn't end here. Rather, a good PEG ratio should alert you that it may be worthwhile to take a closer look at the stock.
The Company May Be Profitable, but Its Balance Sheet Is Highly Leveraged:
| 2018 | 2019 | 2020 | 2021 | 2022 | 2023 | |
|---|---|---|---|---|---|---|
| Revenue (MM) | $7,987 | $9,730 | $9,358 | $15,864 | $33,428 | $29,349 |
| Gross Margins | 25% | 24% | 28% | -4% | 14% | 48% |
| Operating Margins | 25% | 24% | 28% | -4% | 14% | 48% |
| Net Margins | 15% | 13% | 6% | 5% | 8% | 36% |
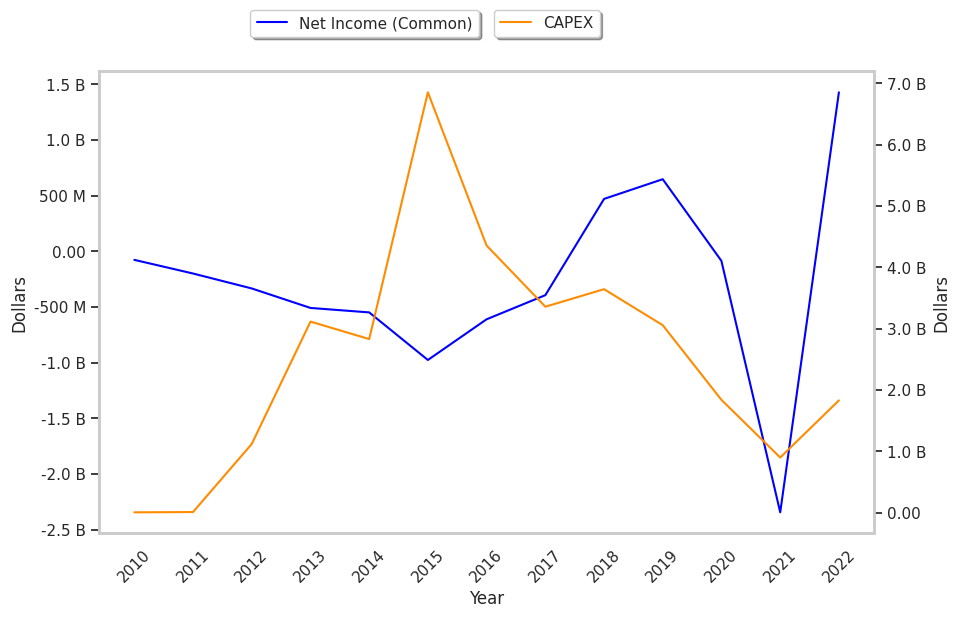
| Net Income (MM) | $1,200 | $1,232 | $586 | $778 | $2,635 | $10,645 |
| Net Interest Expense (MM) | $875 | $1,432 | $1,525 | $1,438 | $1,406 | $1,288 |
| Depreciation & Amort. (MM) | $449 | $794 | $932 | $1,011 | $1,119 | $1,166 |
| Earnings Per Share | $1.9 | $2.51 | -$0.34 | -$9.25 | $5.64 | $33.86 |
| Diluted Shares (MM) | 248 | 258 | 252 | 253 | 253 | 233 |
| Free Cash Flow (MM) | -$1,653 | -$1,223 | -$574 | $1,503 | $8,693 | $8,500 |
| Capital Expenditures (MM) | $3,643 | $3,056 | $1,839 | $966 | $1,830 | $1,851 |
| Net Current Assets (MM) | $2,386 | $217 | -$1,123 | -$6,915 | -$14,256 | -$6,175 |
| Long Term Debt (MM) | $28,236 | $30,774 | $30,471 | $29,449 | $24,055 | $23,380 |
| Net Debt / EBITDA | 10.24 | 8.81 | 8.01 | 90.32 | 3.94 | 1.32 |
Cheniere Energy has exceptional EPS growth and growing revenues and decreasing reinvestment in the business. Additionally, the company's financial statements display decent operating margins with a positive growth rate and generally positive cash flows. However, the firm suffers from slimmer gross margins than its peers and a highly leveraged balance sheet.