PepsiCo logged a 0.3% change during today's evening session, and is now trading at a price of $168.86 per share.
PepsiCo returned losses of -6.0% last year, with its stock price reaching a high of $196.88 and a low of $155.83. Over the same period, the stock underperformed the S&P 500 index by -22.0%. As of April 2023, the company's 50-day average price was $166.43. PepsiCo, Inc. manufactures, markets, distributes, and sells various beverages and convenient foods worldwide. Based in Purchase, NY, the large-cap Consumer Staples company has 315,000 full time employees. PepsiCo has offered a 2.9% dividend yield over the last 12 months.
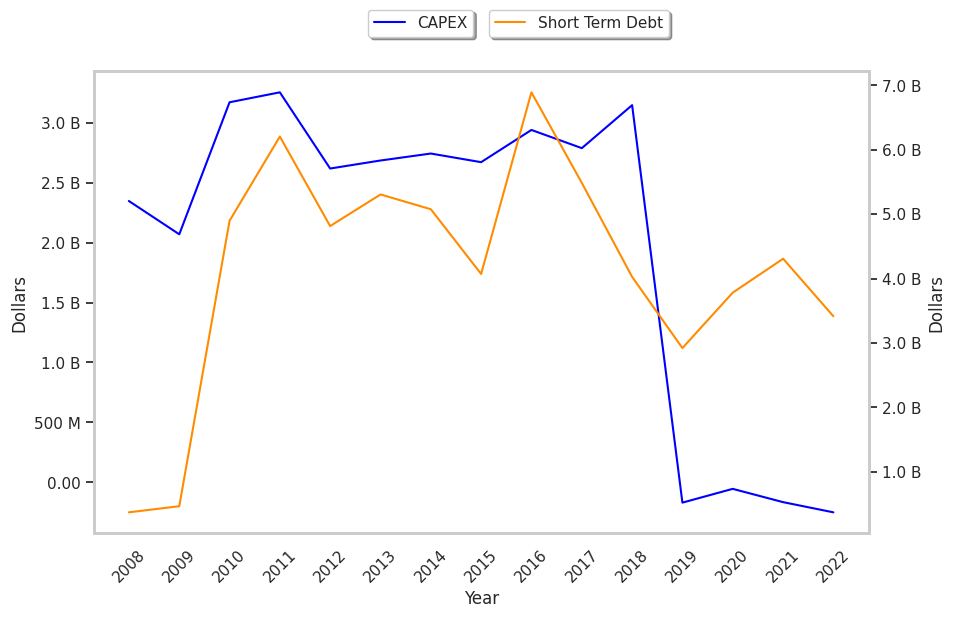
Growing Revenues With Increasing Reinvestment in the Business:
| 2018 | 2019 | 2020 | 2021 | 2022 | 2023 | |
|---|---|---|---|---|---|---|
| Revenue (MM) | $64,661 | $67,161 | $70,372 | $79,474 | $86,392 | $149,564 |
| Gross Margins | 55% | 55% | 55% | 53% | 53% | 55% |
| Operating Margins | 16% | 15% | 14% | 14% | 13% | 16% |
| Net Margins | 19% | 11% | 10% | 10% | 10% | 12% |
| Net Income (MM) | $12,559 | $7,353 | $7,175 | $7,679 | $8,978 | $18,433 |
| Net Interest Expense (MM) | $1,219 | $935 | $1,128 | $1,863 | $939 | $1,405 |
| Depreciation & Amort. (MM) | $2,399 | $2,432 | $2,548 | $2,710 | $2,763 | $2,882 |
| Earnings Per Share | $8.78 | $5.2 | $5.12 | $5.49 | $6.42 | $13.23 |
| Diluted Shares (MM) | 1,428 | 1,411 | 1,395 | 1,389 | 1,387 | 5,535 |
| Free Cash Flow (MM) | $6,133 | $5,417 | $6,373 | $6,991 | $5,604 | $6,947 |
| Capital Expenditures (MM) | $3,282 | $4,232 | $4,240 | $4,625 | $5,207 | $5,188 |
| Net Current Assets (MM) | -$41,153 | -$46,034 | -$56,365 | -$54,443 | -$53,375 | -$52,334 |
| Long Term Debt (MM) | $28,295 | $29,148 | $40,370 | $36,026 | $35,657 | $35,657 |
| Net Debt / EBITDA | 2.18 | 2.25 | 3.04 | 2.72 | 2.64 | 1.42 |
PepsiCo has growing revenues and increasing reinvestment in the business, positive EPS growth, and healthy leverage. However, the firm suffers from slimmer gross margins than its peers and weak operating margins with a stable trend. Finally, we note that PepsiCo has irregular cash flows.
PepsiCo's Valuation Is in Line With Its Sector Averages:
PepsiCo has a trailing twelve month P/E ratio of 27.8, compared to an average of 24.36 for the Consumer Staples sector. Based on its EPS guidance of $8.15, the company has a forward P/E ratio of 20.4. The company doesn't issue forward earnings guidance, and the compound average growth rate of its last 6 years of reported EPS is 7.1%. On this basis, the company's PEG ratio is 3.93, which suggests that it is overpriced. Furthermore, PepsiCo is likely overvalued compared to the book value of its equity, since its P/B ratio of 12.35 is higher than the sector average of 4.29. The company's shares are currently trading 430.0% above their Graham number.
Analysts Give PepsiCo an Average Rating of Buy:
The 21 analysts following PepsiCo have set target prices ranging from $151.0 to $220.0 per share, for an average of $189.08 with a buy rating. As of April 2023, the company is trading -12.0% away from its average target price, indicating that there is an analyst consensus of some upside potential.
PepsiCo has a very low short interest because 1.1% of the company's shares are sold short. Institutions own 76.0% of the company's shares, and the insider ownership rate stands at 0.16%, suggesting a small amount of insider investors. The largest shareholder is Vanguard Group Inc, whose 9% stake in the company is worth $22,156,713,378.