Today we're going to take a closer look at large-cap Energy company Chevron, whose shares are currently trading at $143.52. We've been asking ourselves whether the company is under or over valued at today's prices... let's perform a brief value analysis to find out!
Trades Below Its Graham Number but Has an Elevated P/E Ratio:
Chevron Corporation, through its subsidiaries, engages in the integrated energy and chemicals operations in the United States and internationally. The company belongs to the Energy sector, which has an average price to earnings (P/E) ratio of 7.54 and an average price to book (P/B) ratio of 1.68. In contrast, Chevron has a trailing 12 month P/E ratio of 10.7 and a P/B ratio of 1.64.
When we divide Chevron's P/E ratio by its expected EPS growth rate of the next five years, we obtain its PEG ratio of -1.52. Since it's negative, the company has negative growth expectations, and most investors will probably avoid the stock unless it has an exceptionally low P/E and P/B ratio.
Growing Revenues With a Flat Capital Expenditure Trend:
| 2018 | 2019 | 2020 | 2021 | 2022 | 2023 | |
|---|---|---|---|---|---|---|
| Revenue (MM) | $166,339 | $146,516 | $94,692 | $162,465 | $246,252 | $210,242 |
| Gross Margins | 12% | 4% | -8% | 13% | 20% | 17% |
| Operating Margins | 12% | 4% | -8% | 13% | 20% | 17% |
| Net Margins | 9% | 2% | 0% | 10% | 14% | 12% |
| Net Income (MM) | $14,860 | $2,924 | -$18 | $15,689 | $35,608 | $25,546 |
| Net Interest Expense (MM) | $748 | $798 | $697 | $712 | $516 | $472 |
| Depreciation & Amort. (MM) | $19,419 | $29,218 | $19,508 | $17,925 | $16,319 | $15,836 |
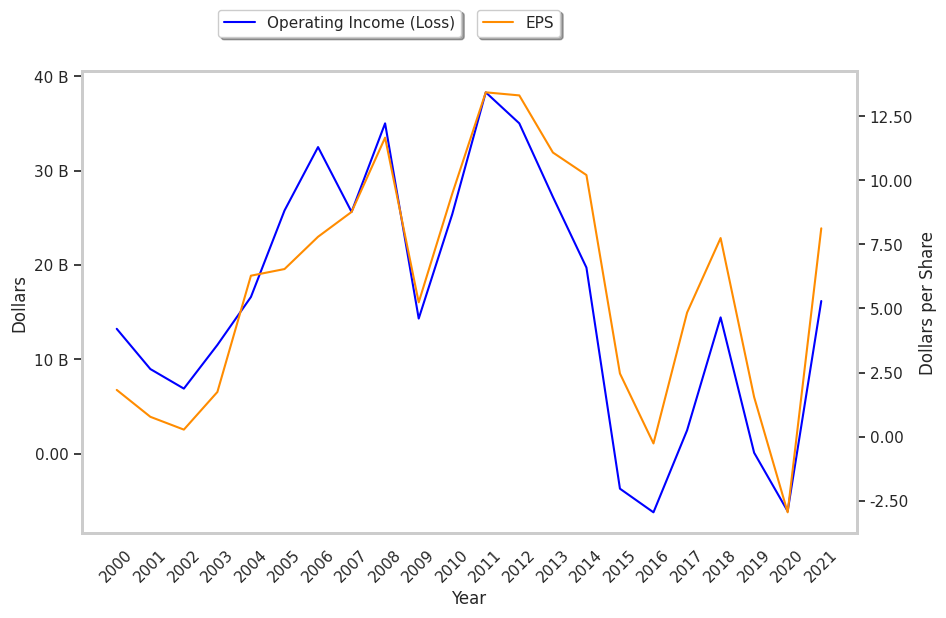
| Earnings Per Share | $7.74 | $1.54 | -$2.96 | $8.14 | $18.28 | $13.47 |
| Diluted Shares (MM) | 1,914 | 1,895 | 1,870 | 1,920 | 1,940 | 1,752 |
| Free Cash Flow (MM) | $16,826 | $13,198 | $1,655 | $21,131 | $37,628 | $20,370 |
| Capital Expenditures (MM) | $13,792 | $14,116 | $8,922 | $8,056 | $11,974 | $15,303 |
| Net Current Assets (MM) | -$64,200 | -$63,891 | -$80,986 | -$65,857 | -$47,124 | -$55,947 |
| Long Term Debt (MM) | $40,823 | $37,246 | $55,529 | $46,879 | $37,687 | $39,425 |
| Net Debt / EBITDA | 0.9 | 0.97 | 4.19 | 1.03 | 0.31 | 0.65 |
Chevron has growing revenues and a flat capital expenditure trend, low leverage, and positive EPS growth. However, the firm suffers from slimmer gross margins than its peers and weak operating margins with a positive growth rate. Finally, we note that Chevron has irregular cash flows.