Nike logged a -0.1% change during today's evening session, and is now trading at a price of $110.27 per share.
Over the last year, Nike logged a -0.0% change, with its stock price reaching a high of $131.31 and a low of $88.66. Over the same period, the stock underperformed the S&P 500 index by -13.0%. As of April 2023, the company's 50-day average price was $101.41. NIKE, Inc., together with its subsidiaries, designs, develops, markets, and sells athletic footwear, apparel, equipment, accessories, and services worldwide. Based in Beaverton, OR, the large-cap Consumer Discretionary company has 83,700 full time employees. Nike has offered a 1.2% dividend yield over the last 12 months.
Growing Revenues With a Flat Capital Expenditure Trend:
| 2018 | 2019 | 2020 | 2021 | 2022 | 2023 | |
|---|---|---|---|---|---|---|
| Revenue (MM) | $36,397 | $39,117 | $37,403 | $44,538 | $46,710 | $51,217 |
| Gross Margins | 44% | 45% | 43% | 45% | 46% | 44% |
| Operating Margins | 12% | 12% | 8% | 15% | 14% | 12% |
| Net Margins | 5% | 10% | 7% | 13% | 13% | 10% |
| Net Income (MM) | $1,933 | $4,029 | $2,539 | $5,727 | $6,046 | $5,070 |
| Net Interest Expense (MM) | -$54 | $78 | -$89 | -$14 | $181 | $280 |
| Depreciation & Amort. (MM) | $747 | $705 | $721 | $744 | $717 | $703 |
| Earnings Per Share | $1.17 | $2.49 | $1.6 | $3.56 | $3.75 | $3.2300000000000004 |
| Diluted Shares (MM) | 1,659 | 1,618 | 1,592 | 1,609 | 1,611 | 1,570 |
| Free Cash Flow (MM) | $3,927 | $4,784 | $1,399 | $5,962 | $4,430 | $4,872 |
| Capital Expenditures (MM) | $1,028 | $1,119 | $1,086 | $695 | $758 | $969 |
| Net Current Assets (MM) | $5,084 | $5,303 | $8,821 | $12,601 | $11,996 | $10,364 |
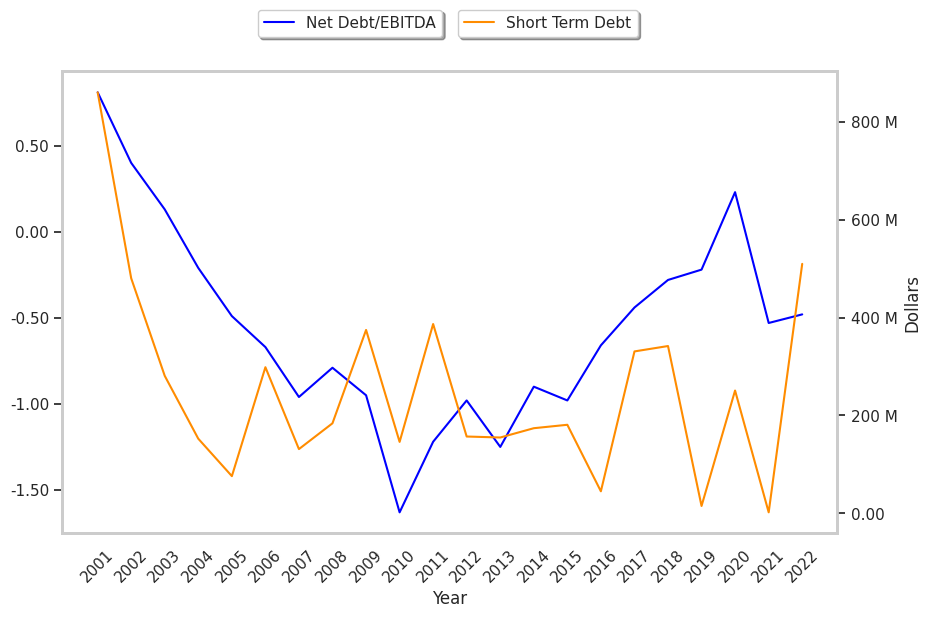
| Long Term Debt (MM) | $3,466 | $3,462 | $9,410 | $9,417 | $8,924 | $8,929 |
| Net Debt / EBITDA | 0.01 | 0.07 | 0.23 | -0.18 | 0.4 | 0.4 |
Nike has growing revenues and a flat capital expenditure trend, low leverage, and a strong EPS growth trend. However, the firm has slimmer gross margins than its peers. Finally, we note that Nike has average net margins with a stable trend and irregular cash flows.
The Market May Be Overvaluing Nike's Earnings and Assets:
Nike has a trailing twelve month P/E ratio of 31.3, compared to an average of 22.33 for the Consumer Discretionary sector. Based on its EPS guidance of $3.95, the company has a forward P/E ratio of 25.7. Nike's PEG ratio is 3.11 on the basis of the 10.0% weighted average of the company and the broader market's EPS compound average growth rates. This suggests that the company's shares are overvalued. Furthermore, Nike is likely overvalued compared to the book value of its equity, since its P/B ratio of 12.03 is higher than the sector average of 3.12. The company's shares are currently trading 330.9% above their Graham number.
Nike Has an Average Rating of Buy:
The 33 analysts following Nike have set target prices ranging from $79.96 to $136.29 per share, for an average of $108.55 with a buy rating. As of April 2023, the company is trading -6.6% away from its average target price, indicating that there is an analyst consensus of little upside potential.
Nike has a very low short interest because 1.7% of the company's shares are sold short. Institutions own 83.7% of the company's shares, and the insider ownership rate stands at 1.4%, suggesting a large amount of insider shareholders. The largest shareholder is Vanguard Group Inc, whose 9% stake in the company is worth $11,892,024,341.