We've been asking ourselves recently if the market has placed a fair valuation on Enterprise Products Partners. Let's dive into some of the fundamental values of this large-cap Utilities company to determine if there might be an opportunity here for value-minded investors.
Enterprise Products Partners Is Fairly Valued:
Enterprise Products Partners L.P. provides midstream energy services to producers and consumers of natural gas, natural gas liquids (NGLs), crude oil, petrochemicals, and refined products. The company belongs to the Utilities sector, which has an average price to earnings (P/E) ratio of 22.89 and an average price to book (P/B) ratio of 1.03. In contrast, Enterprise Products Partners has a trailing 12 month P/E ratio of 10.9 and a P/B ratio of 2.15.
Enterprise Products Partners's PEG ratio is 1.78, which shows that the stock is probably overvalued in terms of its estimated growth. For reference, a PEG ratio near or below 1 is a potential signal that a company is undervalued.
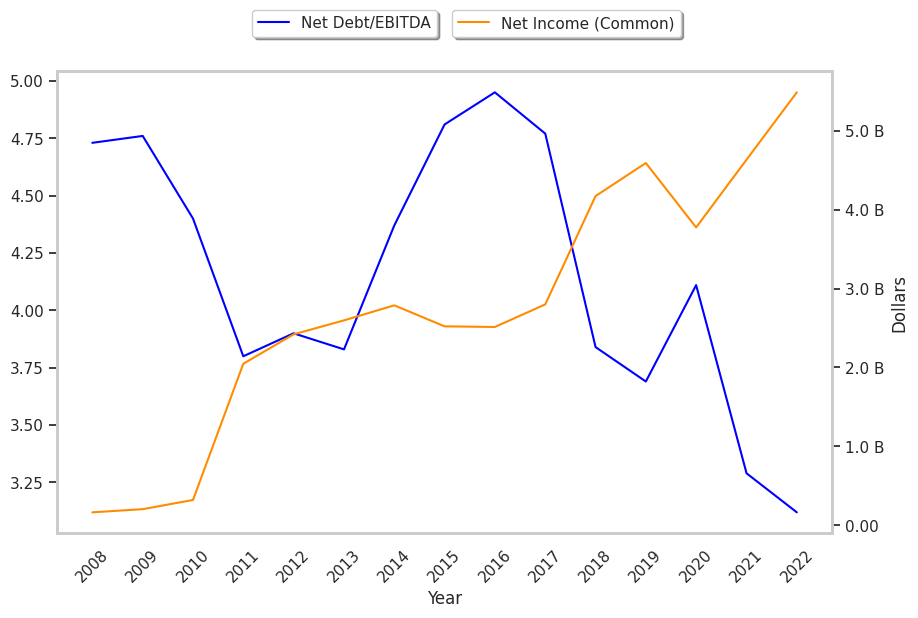
The Company May Be Profitable, but Its Balance Sheet Is Highly Leveraged:
| 2018 | 2019 | 2020 | 2021 | 2022 | 2023 | |
|---|---|---|---|---|---|---|
| Revenue (MM) | $36,534 | $32,789 | $27,200 | $40,807 | $58,186 | $48,743 |
| Gross Margins | 13% | 17% | 17% | 14% | 11% | 13% |
| Operating Margins | 15% | 19% | 19% | 15% | 12% | 14% |
| Net Margins | 12% | 14% | 14% | 12% | 10% | 11% |
| Net Income (MM) | $4,238 | $4,687 | $3,886 | $4,755 | $5,615 | $5,507 |
| Net Interest Expense (MM) | $1,097 | $1,243 | $1,287 | $1,283 | $1,244 | $1,251 |
| Depreciation & Amort. (MM) | $1,792 | $1,949 | $2,072 | $1,705 | $1,779 | $1,829 |
| Free Cash Flow (MM) | $1,903 | $1,989 | $2,603 | $6,290 | $6,075 | $4,913 |
| Capital Expenditures (MM) | $4,223 | $4,532 | $3,288 | $2,223 | $1,964 | $3,015 |
| Net Current Assets (MM) | -$1,939 | -$2,399 | -$70 | $517 | -$3,061 | -$2,507 |
| Long Term Debt (MM) | $24,678 | $25,643 | $28,541 | $28,135 | $26,551 | $27,446 |
| Net Debt / EBITDA | 4.14 | 4.09 | 4.85 | 4.49 | 4.18 | 4.34 |