Netflix logged a -0.8% change during today's afternoon session, and is now trading at a price of $450.15 per share.
Netflix returned gains of 47.0% last year, with its stock price reaching a high of $485.0 and a low of $273.41. Over the same period, the stock outperformed the S&P 500 index by 30.0%. More recently, the company's 50-day average price was $416.72. Netflix, Inc. provides entertainment services. It offers TV series, documentaries, feature films, and mobile games across various genres and languages. Based in Los Gatos, CA, the large-cap Consumer Discretionary company has 12,800 full time employees. Netflix has not offered a dividend during the last year.
The Company May Be Profitable, but Its Balance Sheet Is Highly Leveraged:
| 2018 | 2019 | 2020 | 2021 | 2022 | 2023 | |
|---|---|---|---|---|---|---|
| Revenue (MM) | $15,794 | $20,156 | $24,996 | $29,698 | $31,616 | $32,743 |
| Revenue Growth | n/a | 27.62% | 24.01% | 18.81% | 6.46% | 3.56% |
| Operating Margins | 10% | 13% | 18% | 21% | 18% | 18% |
| Net Margins | 8% | 9% | 11% | 17% | 14% | 14% |
| Net Income (MM) | $1,211 | $1,867 | $2,761 | $5,116 | $4,492 | $4,525 |
| Net Interest Expense (MM) | $420 | $626 | $767 | $766 | $706 | $695 |
| Depreciation & Amort. (MM) | $83 | $104 | $116 | $208 | $337 | $364 |
| Earnings Per Share | $2.68 | $4.13 | $6.08 | $11.24 | $9.95 | $10.02 |
| EPS Growth | n/a | 54.1% | 47.22% | 84.87% | -11.48% | 0.7% |
| Diluted Shares (MM) | 451 | 452 | 454 | 455 | 451 | 452 |
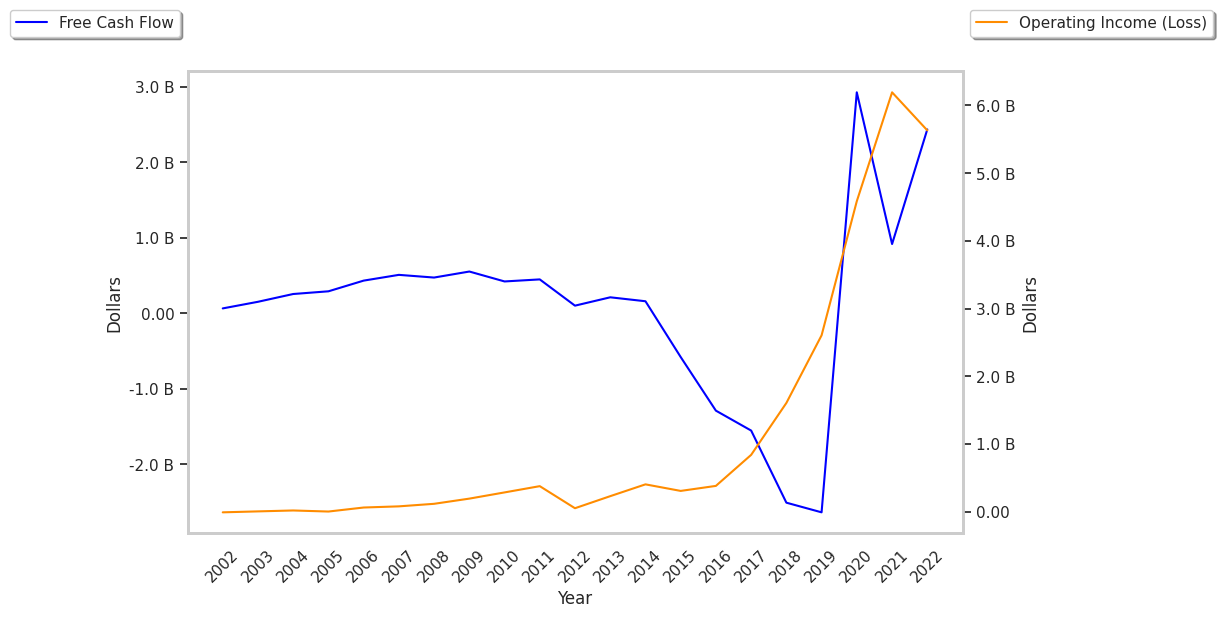
| Free Cash Flow (MM) | -$2,854 | -$3,140 | $1,929 | -$132 | $1,619 | $5,677 |
| Capital Expenditures (MM) | $174 | $253 | $498 | $525 | $408 | $379 |
| Current Ratio | 1.49 | 0.9 | 1.25 | 0.95 | 1.17 | 1.29 |
| Long Term Debt (MM) | $10,360 | $14,759 | $15,809 | $14,693 | $14,353 | $13,901 |
| Net Debt / EBITDA | 6.21 | 4.69 | 2.29 | 1.78 | 1.9 | 1.38 |
Netflix has growing revenues and increasing reinvestment in the business, exceptional EPS growth, and decent operating margins with a positive growth rate. However, the firm has a highly leveraged balance sheet. Finally, we note that Netflix has irregular cash flows.
Netflix's P/B and P/E Ratios Are Higher Than Average:
Netflix has a trailing twelve month P/E ratio of 41.5, compared to an average of 22.96 for the Consumer Discretionary sector. Based on its EPS guidance of $15.82, the company has a forward P/E ratio of 26.3. Netflix's PEG ratio is 3.94 on the basis of the 10.5% weighted average of the company and the broader market's EPS compound average growth rates. This suggests that the company's shares are overvalued. Furthermore, Netflix is likely overvalued compared to the book value of its equity, since its P/B ratio of 8.91 is higher than the sector average of 4.24. The company's shares are currently trading 324.8% above their Graham number.
Netflix Has an Analyst Consensus of Some Upside Potential:
The 37 analysts following Netflix have set target prices ranging from $335.0 to $600.0 per share, for an average of $465.08 with a buy rating. As of April 2023, the company is trading -10.4% away from its average target price, indicating that there is an analyst consensus of some upside potential.
Netflix has an average amount of shares sold short because 2.3% of the company's shares are sold short. Institutions own 83.9% of the company's shares, and the insider ownership rate stands at 1.35%, suggesting a large amount of insider shareholders. The largest shareholder is Vanguard Group Inc, whose 8% stake in the company is worth $16,322,566,621.