Now trading at a price of $70.67, Fortive has moved 2.6% so far today.
Over the last year, Fortive logged a 2.8% change, with its stock price reaching a high of $79.9 and a low of $62.7. Over the same period, the stock underperformed the S&P 500 index by -12.6%. As of April 2023, the company's 50-day average price was $69.36. Fortive Corporation designs, develops, manufactures, markets, and services professional and engineered products, software, and services worldwide. Based in Everett, WA, the large-cap Industrials company has 18,000 full time employees. Fortive has offered a 0.4% dividend yield over the last 12 months.
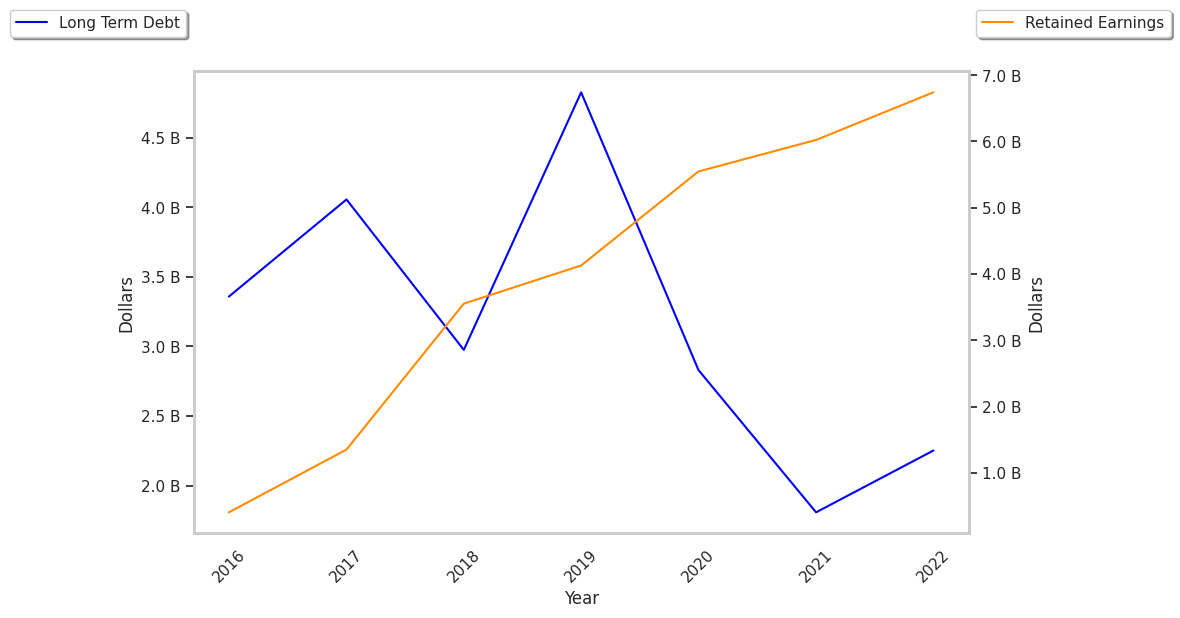
The Company May Be Profitable, but Its Balance Sheet Is Highly Leveraged:
| 2018 | 2019 | 2020 | 2021 | 2022 | 2023 | |
|---|---|---|---|---|---|---|
| Revenue (MM) | $3,800 | $4,564 | $4,634 | $5,255 | $5,826 | $6,012 |
| Revenue Growth | n/a | 20.09% | 1.54% | 13.38% | 10.87% | 3.19% |
| Operating Margins | 17% | 10% | 33% | 15% | 17% | 19% |
| Net Margins | 77% | 16% | 35% | 12% | 13% | 14% |
| Net Income (MM) | $2,914 | $739 | $1,613 | $614 | $755 | $828 |
| Net Interest Expense (MM) | $77 | $143 | $148 | $103 | $98 | $127 |
| Depreciation & Amort. (MM) | $70 | $80 | $74 | $75 | $84 | $86 |
| Earnings Per Share | $8.21 | $1.97 | $4.49 | $1.63 | $2.1 | $2.33 |
| Free Cash Flow (MM) | $1,274 | $1,197 | $1,361 | $943 | $1,207 | $1,261 |
| Capital Expenditures (MM) | $70 | $74 | $76 | $50 | $96 | $110 |
| Current Ratio | 1.45 | 1.06 | 1.55 | 0.68 | 0.91 | 1.02 |
| Total Debt (MM) | $3,430 | $5,450 | $3,273 | $2,754 | $3,251 | $2,732 |
| Net Debt / EBITDA | 3.15 | 8.09 | 0.92 | 2.18 | 2.37 | 1.68 |
Fortive has declining EPS growth, irregular cash flows, and a highly leveraged balance sheet. On the other hand, the company benefits from growing revenues and increasing reinvestment in the business and decent operating margins with a stable trend.
A Lower P/B Ratio Than Its Sector Average but Trades Above Its Graham Number:
Fortive has a trailing twelve month P/E ratio of 29.8, compared to an average of 22.19 for the Industrials sector. Based on its EPS guidance of $3.65, the company has a forward P/E ratio of 19.0. The -10.9% compound average growth rate of Fortive's historical and projected earnings per share yields a PEG ratio of -2.72. This indicates that its shares are overvalued.In contrast, the market is likely undervaluing Fortive in terms of its equity because its P/B ratio is 2.46 while the sector average is 4.06. The company's shares are currently trading 79.2% above their Graham number.
Analysts Give Fortive an Average Rating of Buy:
The 17 analysts following Fortive have set target prices ranging from $66.0 to $90.0 per share, for an average of $77.71 with a buy rating. As of April 2023, the company is trading -10.7% away from its average target price, indicating that there is an analyst consensus of some upside potential.
Fortive has a very low short interest because 0.8% of the company's shares are sold short. Institutions own 98.2% of the company's shares, and the insider ownership rate stands at 0.22%, suggesting a small amount of insider investors. The largest shareholder is Vanguard Group Inc, whose 11% stake in the company is worth $2,771,554,857.