Comcast logged a 0.0% change during today's evening session, and is now trading at a price of $42.67 per share.
Comcast returned gains of 16.2% last year, with its stock price reaching a high of $47.46 and a low of $33.78. Over the same period, the stock outperformed the S&P 500 index by 1.2%. More recently, the company's 50-day average price was $42.55. Comcast Corporation operates as a media and technology company worldwide. Based in Philadelphia, PA, the large-cap Telecommunications company has 186,000 full time employees. Comcast has offered a 2.7% dividend yield over the last 12 months.
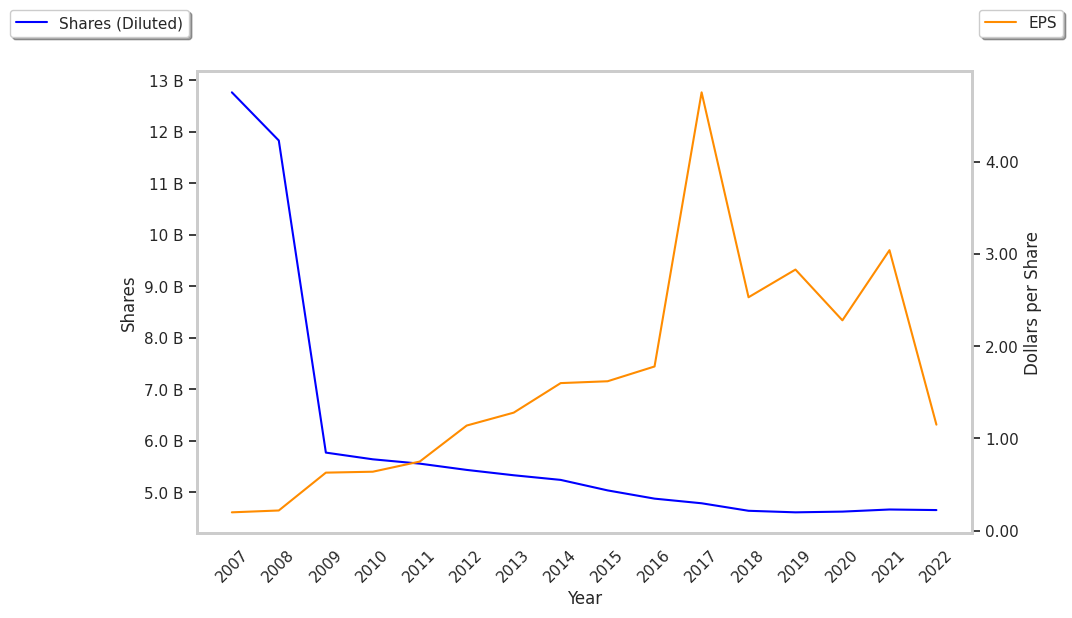
EPS Trend Sustained Primarily by Reducing the Number of Shares Outstanding:
| 2018 | 2019 | 2020 | 2021 | 2022 | 2023 | |
|---|---|---|---|---|---|---|
| Revenue (MM) | $94,507 | $108,942 | $103,564 | $116,385 | $121,427 | $120,871 |
| Revenue Growth | n/a | 15.27% | -4.94% | 12.38% | 4.33% | -0.46% |
| Operating Margins | 20% | 19% | 17% | 18% | 12% | 19% |
| Net Margins | 13% | 12% | 10% | 12% | 4% | 13% |
| Net Income (MM) | $11,862 | $13,323 | $10,701 | $14,159 | $5,370 | $15,151 |
| Net Interest Expense (MM) | $3,542 | $4,567 | $4,588 | $4,281 | $3,896 | $4,043 |
| Depreciation & Amort. (MM) | $8,281 | $8,663 | $8,320 | $13,804 | $13,821 | $14,050 |
| Earnings Per Share | $2.56 | $2.89 | $2.31 | $3.04 | $1.21 | $4.25 |
| EPS Growth | n/a | 12.89% | -20.07% | 31.6% | -60.2% | 251.24% |
| Diluted Shares (MM) | 4,640 | 4,610 | 4,624 | 4,654 | 4,430 | 3,564 |
| Free Cash Flow (MM) | $14,523 | $15,744 | $15,558 | $19,972 | $15,787 | $17,028 |
| Capital Expenditures (MM) | $9,774 | $9,953 | $9,179 | $9,174 | $10,626 | $11,434 |
| Current Ratio | 0.79 | 0.84 | 0.93 | 0.85 | 0.78 | 0.7 |
| Total Debt (MM) | $111,743 | $102,217 | $105,466 | $96,672 | $96,581 | $104,156 |
| Net Debt / EBITDA | 3.95 | 3.25 | 3.63 | 2.54 | 3.3 | 2.61 |
Comcast has EPS growth achieved by reducing the number of outstanding shares, irregular cash flows, and a highly leveraged balance sheet. On the other hand, the company has growing revenues and a flat capital expenditure trend working in its favor. Furthermore, Comcast has average net margins with a stable trend.
The Market May Be Undervaluing Comcast's Earnings and Assets:
Comcast has a trailing twelve month P/E ratio of 11.9, compared to an average of 23.78 for the Telecommunications sector. Based on its EPS guidance of $4.31, the company has a forward P/E ratio of 9.9. The 7.7% compound average growth rate of Comcast's historical and projected earnings per share yields a PEG ratio of 1.53. This suggests that these shares are overvalued. In contrast, the market is likely undervaluing Comcast in terms of its equity because its P/B ratio is 2.1 while the sector average is 3.46. The company's shares are currently trading -9.7% below their Graham number.
Comcast Has an Analyst Consensus of Some Upside Potential:
The 26 analysts following Comcast have set target prices ranging from $41.0 to $55.0 per share, for an average of $49.31 with a buy rating. As of April 2023, the company is trading -13.7% away from its average target price, indicating that there is an analyst consensus of some upside potential.
Comcast has a very low short interest because 1.2% of the company's shares are sold short. Institutions own 88.0% of the company's shares, and the insider ownership rate stands at 0.73%, suggesting a small amount of insider investors. The largest shareholder is Vanguard Group Inc, whose 10% stake in the company is worth $16,331,564,596.