We've been asking ourselves recently if the market has placed a fair valuation on AT&T. Let's dive into some of the fundamental values of this large-cap Telecommunications company to determine if there might be an opportunity here for value-minded investors.
AT&T Has an Attractive P/B Ratio but a Worrisome P/E Ratio:
AT&T Inc. provides telecommunications and technology services worldwide. The company belongs to the Telecommunications sector, which has an average price to earnings (P/E) ratio of 23.78 and an average price to book (P/B) ratio of 3.46. In contrast, AT&T has a trailing 12 month P/E ratio of -10.9 and a P/B ratio of 1.14.
AT&T's PEG ratio is 13.98, which shows that the stock is probably overvalued in terms of its estimated growth. For reference, a PEG ratio near or below 1 is a potential signal that a company is undervalued.
The Company's Revenues Are Declining:
| 2018 | 2019 | 2020 | 2021 | 2022 | 2023 | |
|---|---|---|---|---|---|---|
| Revenue (MM) | $170,756 | $181,193 | $143,050 | $134,038 | $120,741 | $121,749 |
| Revenue Growth | n/a | 6.11% | -21.05% | -6.3% | -9.92% | 0.83% |
| Operating Margins | 15% | 15% | 6% | 22% | -3% | -2% |
| Net Margins | 12% | 8% | 1% | 16% | 1% | 1% |
| Net Income (MM) | $19,953 | $14,975 | $1,355 | $21,479 | $1,469 | $1,191 |
| Net Interest Expense (MM) | $8,450 | $8,622 | $7,850 | $9,387 | $6,108 | $6,538 |
| Depreciation & Amort. (MM) | $28,430 | $28,217 | $22,523 | $17,852 | $18,021 | $18,606 |
| Earnings Per Share | $2.85 | $1.89 | -$0.75 | $2.73 | -$1.13 | -$1.4800000000000004 |
| EPS Growth | n/a | -33.68% | -139.68% | 464.0% | -141.39% | -30.97% |
| Diluted Shares (MM) | 6,806 | 7,348 | 7,466 | 7,503 | 7,587 | 6,612 |
| Free Cash Flow (MM) | $22,351 | $29,033 | $28,440 | $26,412 | $16,186 | $19,803 |
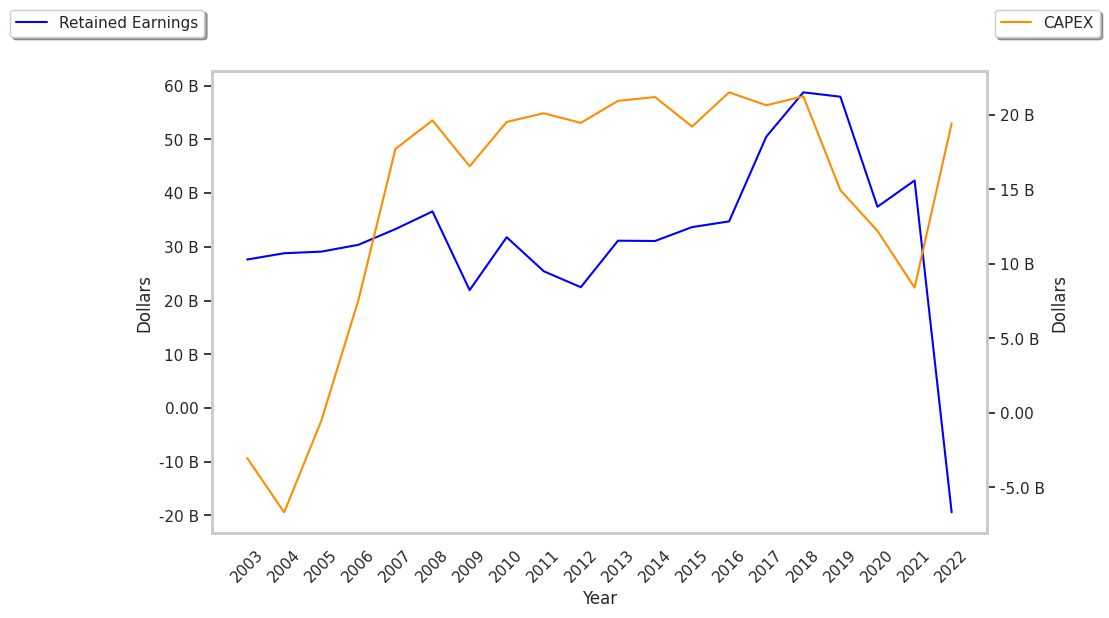
| Capital Expenditures (MM) | $21,251 | $19,635 | $14,690 | $15,545 | $19,626 | $17,481 |
| Current Ratio | 0.8 | 0.79 | 0.82 | 1.61 | 0.59 | 0.69 |
| Total Debt (MM) | $176,505 | $163,147 | $170,551 | $175,631 | $150,228 | $144,147 |
| Net Debt / EBITDA | 3.14 | 2.73 | 5.26 | 3.33 | 9.82 | 8.7 |
AT&T suffers from declining revenues and a flat capital expenditure trend, weak operating margins with a negative growth trend, and declining EPS growth. The firm's financial statements also exhibit irregular cash flows and a highly leveraged balance sheet.