Today we're going to take a closer look at large-cap Utilities company DBA Sempra, whose shares are currently trading at $74.83. We've been asking ourselves whether the company is under or over valued at today's prices... let's perform a brief value analysis to find out!
DBA Sempra's Valuation Is in Line With Its Sector Averages:
Sempra operates as an energy infrastructure company in the United States and internationally. The company belongs to the Utilities sector, which has an average price to earnings (P/E) ratio of 17.53 and an average price to book (P/B) ratio of 1.71. In contrast, DBA Sempra has a trailing 12 month P/E ratio of 17.3 and a P/B ratio of 1.72.
DBA Sempra's PEG ratio is 3.95, which shows that the stock is probably overvalued in terms of its estimated growth. For reference, a PEG ratio near or below 1 is a potential signal that a company is undervalued.
The Company May Be Profitable, but Its Balance Sheet Is Highly Leveraged:
| 2018 | 2019 | 2020 | 2021 | 2022 | 2023 | |
|---|---|---|---|---|---|---|
| Revenue (MM) | $10,102 | $10,829 | $11,370 | $12,857 | $14,439 | $16,684 |
| Revenue Growth | n/a | 7.2% | 5.0% | 13.08% | 12.3% | 15.55% |
| Operating Margins | 7% | 16% | 16% | 6% | 14% | 18% |
| Net Margins | 11% | 22% | 36% | 11% | 16% | 19% |
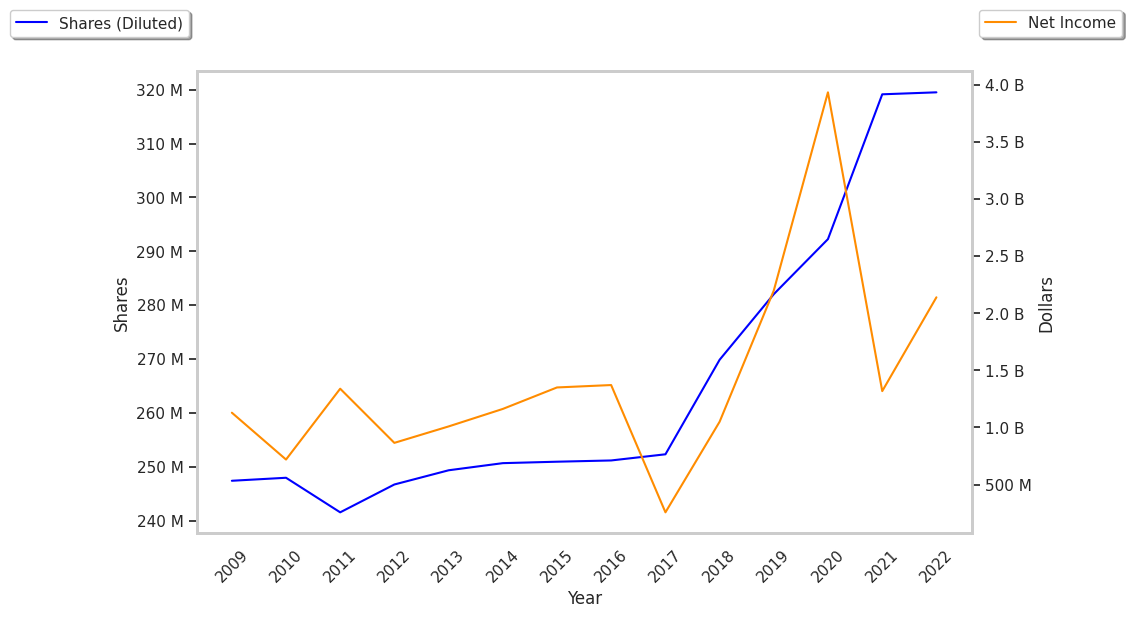
| Net Income (MM) | $1,126 | $2,362 | $4,105 | $1,463 | $2,285 | $3,170 |
| Net Interest Expense (MM) | $886 | $1,077 | $1,081 | $1,198 | $1,054 | $1,253 |
| Depreciation & Amort. (MM) | $1,491 | $1,569 | $1,666 | $1,855 | $2,019 | $2,170 |
| Earnings Per Share | $2.09 | $4.19 | $7.02 | $2.34 | $7.22 | $10.05 |
| EPS Growth | n/a | 100.48% | 67.54% | -66.67% | 208.55% | 39.2% |
| Diluted Shares (MM) | 540 | 564 | 585 | 626 | 316 | 315 |
| Free Cash Flow (MM) | -$28 | -$620 | -$1,034 | -$1,173 | -$4,215 | -$3,075 |
| Capital Expenditures (MM) | $3,544 | $3,708 | $4,676 | $5,015 | $5,357 | $7,891 |
| Current Ratio | 0.48 | 0.36 | 0.66 | 0.44 | 0.6 | 0.61 |
| Total Debt (MM) | $24,571 | $25,816 | $25,799 | $27,822 | $28,919 | $32,521 |
| Net Debt / EBITDA | 11.1 | 7.71 | 7.2 | 10.14 | 7.09 | 6.1 |
DBA Sempra has growing revenues and increasing reinvestment in the business, exceptional EPS growth, and decent operating margins with a positive growth rate. However, the firm has a highly leveraged balance sheet.